
Figure 5.
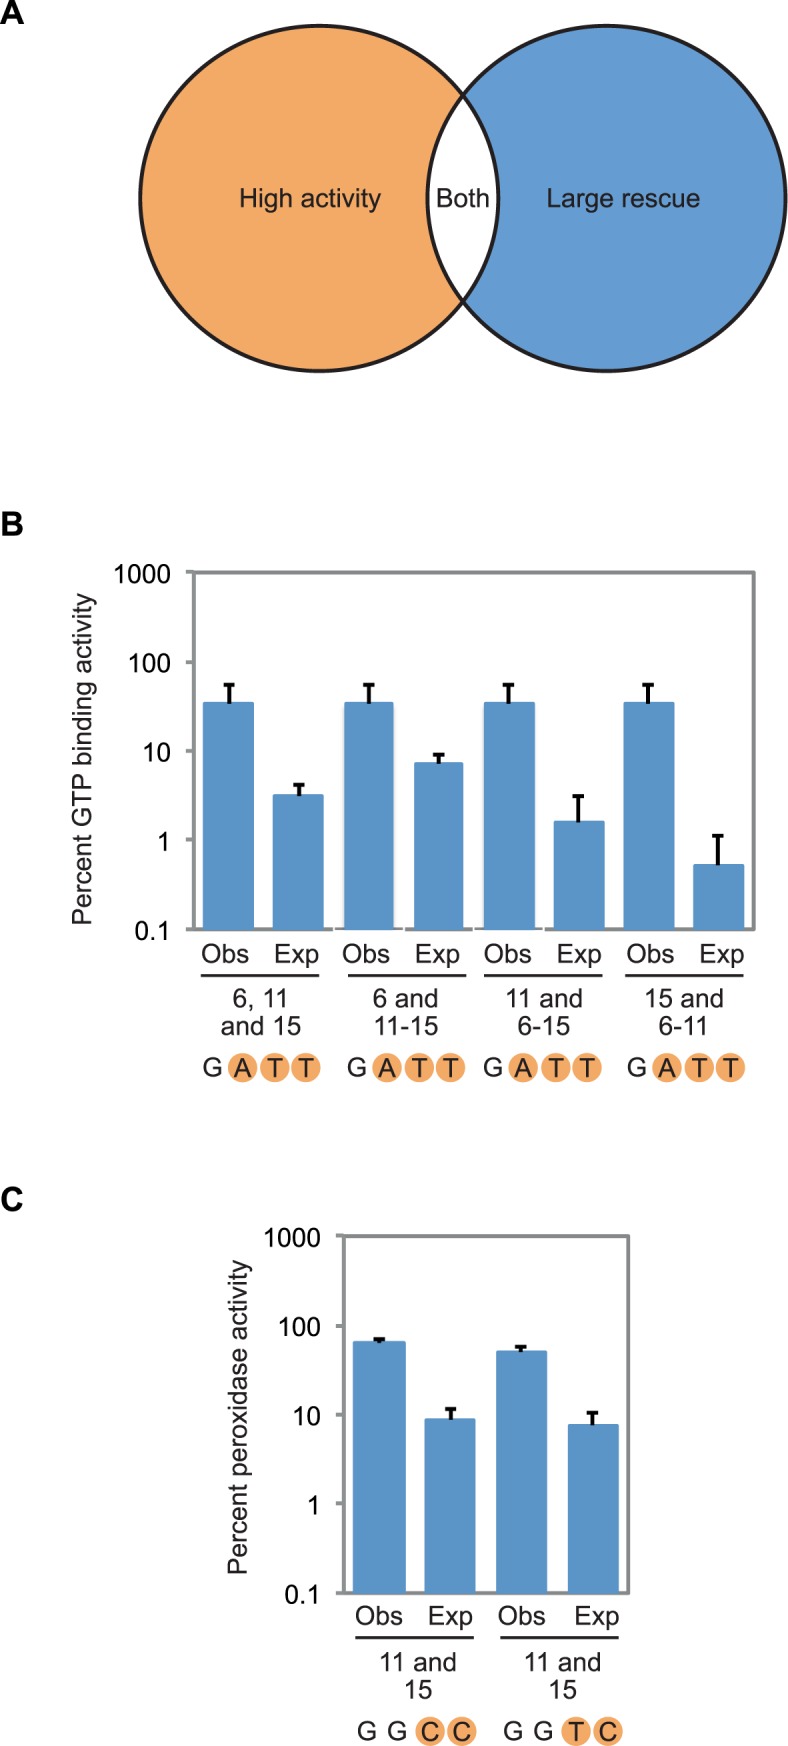
Compensatory mutations in G-quadruplex structures. (A) Overview of the strategy used to identify compensatory mutations. Variants containing such mutations were chosen based on both activity (which was required to be >20% of that of the reference construct) and extent of rescue (which was required to be at least 5-fold higher than expected based on multiplying single mutation effects). (B) Expected and observed GTP-binding activity for the G-G-G-G to G-A-T-T compensatory change. In each case, expected GTP-binding activity was calculated by multiplying the effects of the mutations that make up the G-G-G-G to G-A-T-T mutant, which are indicated below each pair of measurements. Observed activity is the experimentally measured GTP-binding activity of the indicated mutant. (C) Expected and observed peroxidase activity for the G-G-G-G to G-G-C-C and G-G-G-G to G-G-T-C compensatory changes. In each case, expected peroxidase activity was calculated by multiplying the effects of the individual mutations that make up the G-G-G-G to G-G-C-C or G-G-G-G to G-G-T-C mutant, which are indicated below each pair of measurements. Observed activity is the experimentally measured peroxidase activity of the indicated mutant. Experiments in panel (B) were performed at 10 μM DNA concentration in a buffer containing 200 mM KCl, 1 mM MgCl2, 20 mM HEPES pH 7.1, and 10 nM 32P-γ-GTP. Experiments in panel (C) were performed at 10 μM DNA concentration in a buffer containing 200 mM KCl, 1 mM MgCl2, 20 mM HEPES pH 8, 0.05% Triton X-100, 0.5 μM hemin, 1% DMSO, 5 mM ABTS, and 600 μM H2O2. In all panels, GTP-binding and peroxidase activity is expressed relative to that of the reference construct. Reported values represent the average of three experiments and error bars indicate one standard deviation. For expected GTP-binding and peroxidase activity, standard deviations were calculated using standard methods of propagation of error.