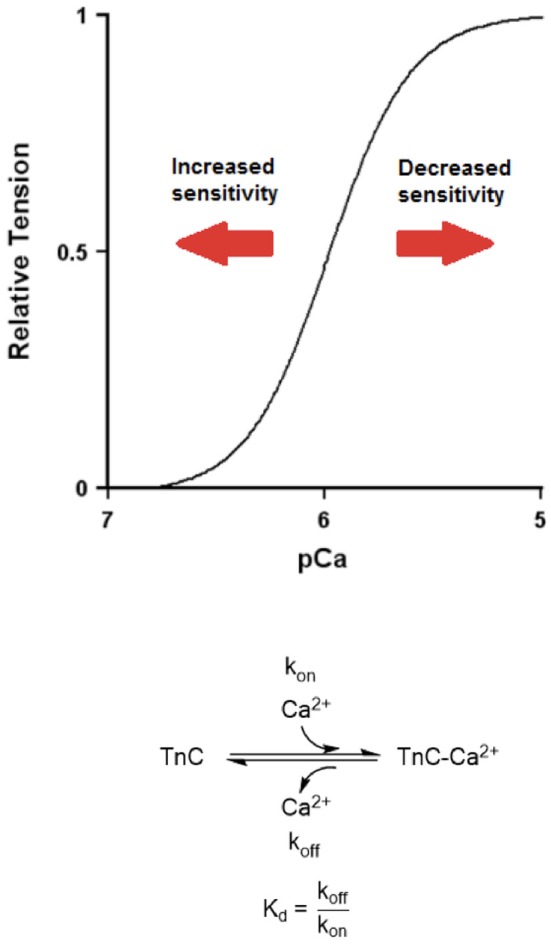
Figure 1.

A hypothetical force-pCa curve demonstrating left- and right-shift (increased and decreased calcium sensitivity, respectively). Bottom. A biochemical equation showing calcium association rate to TnC (kon) and calcium dissociation rate from TnC (koff). A simple equation showing the relationship between equilibrium dissociation constant (Kd), kon, and koff.
