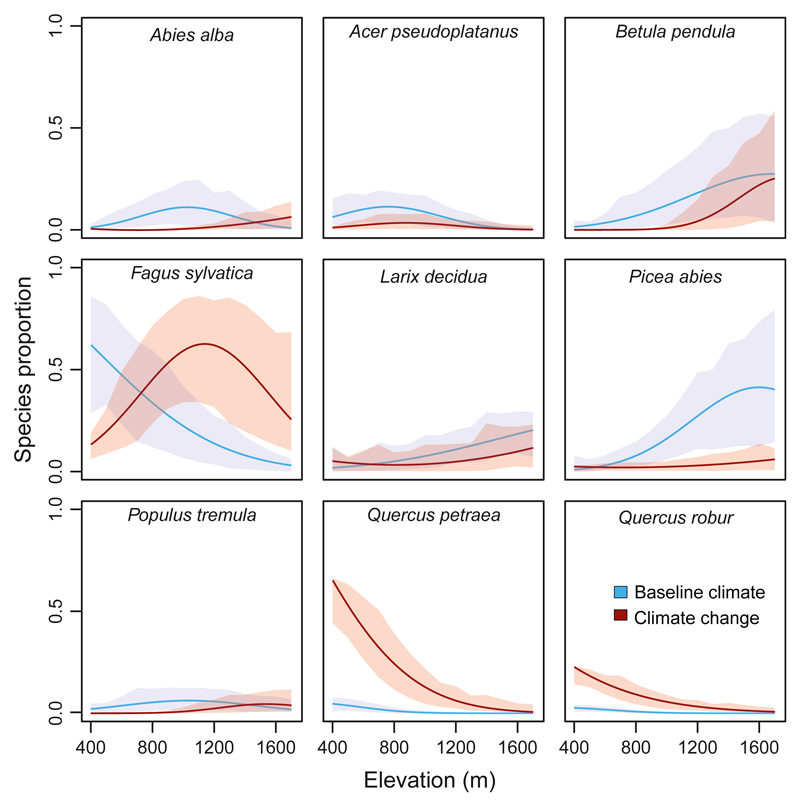
Fig. 4.
Distribution of the nine most common tree species over elevation at Kalkalpen National Park at the end of the 1000 year simulation period (a species proportion of 1 indicates a basal area share of 100%). Lines represent fitted distributions over simulated species occurrence. Shaded areas indicate the 5th to 95th percentile range across all replicates and disturbance scenarios.

