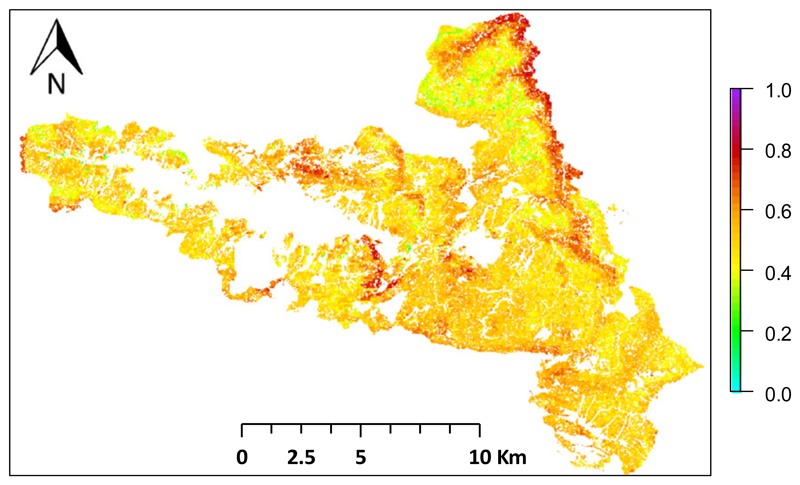
Fig. 5.
Species turnover as a result of changing climate and disturbance regimes. The map shows local species change (100 × 100 m grid) as a consequence of climate change and intensified disturbances (disturbance scenario 9) compared to baseline climate under historic disturbance (disturbance scenario 2). A value of 1 indicates a replacement of 100% of the trees relative to baseline climate.

