

Abstract
RNA-binding proteins (RBPs) and noncoding RNAs orchestrate post-transcriptional processes through the recognition of specific sites on targeted transcripts. Thus, understanding the connection between binding to specific sites and active regulation of the whole transcript is essential. Many immunoprecipitation techniques have been developed that identify either whole transcripts or binding sites of RBPs on each transcript using cell lysates. However, none of these methods simultaneously measures the strength of each binding site and quantifies binding to whole transcripts. In this study, we compare current procedures and present digestion optimized (DO)-RIP-seq, a simple method that locates and quantifies RBP binding sites using a continuous metric. We have used the RBP HuR/ELAVL1 to demonstrate that DO-RIP-seq can quantify HuR binding sites with high coverage across the entire human transcriptome, thereby generating metrics of relative RNA binding strength. We demonstrate that this quantitative enrichment of binding sites is proportional to the relative in vitro binding strength for these sites. In addition, we used DO-RIP-seq to quantify and compare HuR's binding to whole transcripts, thus allowing for seamless integration of binding site data with whole-transcript measurements. Finally, we demonstrate that DO-RIP-seq is useful for identifying functional mRNA target sets and binding sites where combinatorial interactions between HuR and AGO-microRNAs regulate the fate of the transcripts. Our data indicate that DO-RIP-seq will be useful for quantifying RBP binding events that regulate dynamic biological processes.
Keywords: CLIP, protein–RNA affinity, RNA regulons, binding site saturation, crosslink
INTRODUCTION
Identifying the binding sites of RNA-binding proteins (RBPs) is important for understanding the mechanisms of mRNA regulation. This raises a significant question concerning the functional roles of individual binding sites in biological outcomes. For example, how do we distinguish weak from strong binding events, how do combinatorial interactions and protein recruitment lead to cumulative functional outcomes, and what interactions govern the assembly of functional ribonucleoprotein complexes? Answering these questions requires techniques that will identify binding sites of RBPs, quantify the differences in binding strength at these sites, and integrate binding site data to assess functional relevance for whole transcripts.
Many techniques have been invented and developed to identify RBP binding events transcriptome-wide. RNA immunoprecipitation (RIP) followed by sequencing and RNA-crosslinking-immunoprecipitation followed by sequencing were invented in 1999 (Keene et al. 2003) and developed as “RIP-chip” sequencing by hybridization (Tenenbaum et al. 2000) to identify mRNA targets. RNA-crosslinking immunoprecipitation followed by sequencing was subsequently developed by Darnell and coworkers as “CLIP” to also identify mRNA targets (Ule et al. 2003). CLIP procedures were later modified to identify binding sites of RBPs using biochemical and computational adaptations (Licatalosi et al. 2008; Hafner et al. 2010; Konig et al. 2010; Zhang and Darnell 2011). However, early CLIP methodologies did not consider mRNA abundance in their binding-site analyses. Accounting for RNA abundance is essential for determining relative differences between two binding sites or for determining changes in binding at a specific site in response to a stimulus because mRNAs can be present in multiple copies per cell.
In contrast, the RIP technique is quantitative because it accounted for transcript abundance from its inception. For example, RIP-chip using cDNA arrays (Tenenbaum et al. 2000) and RIP-seq using high-throughput sequencing (Zhao et al. 2008, 2010) have been used to quantify whole transcripts bound by RBPs by accounting for mRNA abundance, background binding, and applying normalization to generate probabilistic enrichment values for each RNA–protein interaction (Morris et al. 2008; Mukherjee et al. 2009). The advantage of normalizing RIP data to background is twofold: (i) for distinguishing bona fide targets from background signals, and (ii) for using background to quantify enrichment of each whole transcript. The ability to quantify binding while accounting for RNA abundance is essential for studying changes in RBP–RNA associations that occur during dynamic biological processes or perturbations. For example, the Tenenbaum RIP procedure has been used to quantify the remodeling of RNA–protein interactions at the whole-transcript level during dynamic biological processes such as neuronal differentiation and development (Tenenbaum et al. 2000; Iruarrizaga-Lejarreta et al. 2012), T-cell activation (Mukherjee et al. 2009; Beisang et al. 2012), and tumor growth (Mazan-Mamczarz et al. 2008). However, the traditional RIP-chip procedure does not yield binding sites. Instead, it yields the outcome of the combinations of sites bound in the cell using a continuous, quantitative metric of whole-transcript association. Whether these binding site values for each mRNA are additive is not known.
Despite their different methodologies, RIP and CLIP can produce complementary data when used to study the same RBPs under similar conditions (van der Brug et al. 2008; Sanford et al. 2009; Kershner and Kimble 2010; Jungkamp et al. 2011; Mukherjee et al. 2011; Brooks et al. 2015; Hansen et al. 2015; Ennajdaoui et al. 2016; Prasad et al. 2016; Uren et al. 2016). Therefore, our goal has been to combine aspects of both techniques to produce a single procedure that quantifies RBP–RNA interactions at the whole-transcript level and at the binding site level. Here we introduce digestion-optimized RNA immunoprecipitation cDNA library sequencing (DO-RIP-seq) using the RBP HuR/ELAVL1 as a test case. We demonstrate that DO-RIP-seq can identify HuR binding sites and that these sites agree well with sites defined by traditional methods. We further show that quantitative enrichments of HuR binding sites by DO-RIP-seq can assign relative binding strength for each binding site in cells. Additionally, we show that the sum of HuR binding sites is quantitatively proportional to the enrichment of whole transcripts from undigested RIPs. This will allow for comparisons between binding sites and whole-transcript approaches such as transcriptomic profiling, metabolic labeling of RNA, and ribosome profiling. Finally, we show that the DO-RIP-seq platform allows us to generate evidence for coordination of functionally related groups of RNAs (RNA regulons) at two scales of resolution: the whole-transcript level and the binding-site level. Therefore, DO-RIP-seq is a useful method that provides continuous metrics of enrichment for global protein–RNA interactions and that these values approximate relative differences in binding strength in the cell. Thus, DO-RIP-seq advances the ability to compare mechanistic changes at the binding site level to the remodeling of RNA regulons on a more global level during diverse biological conditions in cells and tissues.
RESULTS
DO-RIP-seq significantly improves transcriptome coverage and reveals binding sites
Our goal was to develop a simple and straightforward procedure to approximate relative RBP binding strength at specific sites across the transcriptome. We combined benefits of both RIP-seq and CLIP-seq that include partial digestion of bound RNA with nucleases to resolve binding sites coupled with utilizing background and normalization to measure the magnitude of binding at each site. As shown in Figure 1, cell lysates were prepared using our standard procedures (Tenenbaum et al. 2000; Keene et al. 2006) and treated with micrococcal nuclease under optimized conditions (see Materials and Methods) to partially digest RNA to fragments bound by the RBP (Fig. 1A). We elected to use micrococcal nuclease because its activity can be inhibited by the addition of EGTA, and thus, the degree of digestion can be tightly controlled. Optimal RNA digestion conditions were determined by treating lysates with increasing amounts of micrococcal nuclease, immunoprecipitating the RBP of interest, followed by extracting and enriching fragment sizes in the range of 20 to 70 nucleotides (nt) in length (Fig. 1B). In addition, RNAs from parallel immunoprecipitations using a nonspecific control antibody or similar negative sample were extracted for normalization of the positive sample. The eluted RNA fragments were then dephosphorylated and radiolabeled at the 5′ ends, and separated by polyacrylamide gels as shown in Figure 1B and C. RNA fragments were subsequently extracted and used to make cDNA libraries for deep sequencing (see Materials and Methods). One important addition to the library procedure was the use of adapters with short random barcodes, or unique molecular identifiers (UMIs), to distinguish PCR amplification artifacts from biologically duplicated sequences (Konig et al. 2010; Kivioja et al. 2012). The use of UMIs greatly increased the amount of useable reads, with the number of rescued reads in the tens of millions for some libraries (Supplemental Fig. S1). The digestion conditions chosen from the optimization experiments were tested using three biological replicates of HuR DO-RIP-seq (Fig. 1C).
FIGURE 1.

(A) A schematic representation of DO-RIP-seq procedure. (MNase, micrococcal nuclease; HuR DO-RIP, DO-RIP done with antibodies against HuR; NEG DO-RIP, negative control DO-RIP with nonspecific antibodies; PAGE, polyacrylamide gel electrophoresis.) (B) Optimization of MNase digestion using immunoprecipitated HuR RNPs. Various amounts of MNase (across the top: gel units of MNase/µg total RNA) were tested (nt, nucleotides). The green rectangle demarcates the preferred conditions; in this case between 73 and 18 gel units of MNase per µg total RNA. (C) RNA fragments after MNase digestion of cell lysates from three biological replicates of HuR (HuR.1/.2/.3) and negative control (Neg.1/.2/.3) DO-RIPs. The boxes demarcate the region of each gel from which RNA was extracted and used to prepare cDNA libraries for sequencing. (D) Comparison of PAR-CLIP-seq (Friedersdorf and Keene 2014) and DO-RIP-seq transcriptome coverage derived from cDNA libraries of immunoprecipitated HuR and Neg based on fragments per thousand per million (FPKM). ([NPC] negative control PAR-CLIP, [HPC] HuR PAR-CLIP, [NDR] negative control DO-RIP-seq, [HDR] HuR DO-RIP-seq). (E) Comparative matrix of R-correlation values for the number of aligned reads at 5-nt intervals of three replicates of HuR and Neg DO-RIP-seq libraries.
In our previous study of HuR RNA targeting using PAR-CLIP, we detected significant background in CLIP data that after accounting for it improved binding site identification (Friedersdorf and Keene 2014). However, the PAR-CLIP background had poor read coverage of the transcriptome (Fig. 1D), and thus was insufficient to normalize all possible positive or negative binding sites. This deficiency precluded quantifying binding because the PAR-CLIP background was an insufficient proxy of transcript abundance. Therefore, to quantify binding with DO-RIP-seq, it was essential to have a high degree of transcriptomic coverage in the negative IPs as well as the positive IPs to account for binding site abundance across all regions. Having solved this, we were able to normalize all possible sites from the positive IP and thus determine the degree of enrichment at particular locations. As shown, the negative IPs yielded >80% coverage of the expressed transcriptome (Fig. 1D). Furthermore, we observed that DO-RIP-seq replicates were highly reproducible at the read count level across the transcriptome (Fig. 1E). Importantly, the correlations among HuR DO-RIP-seq replicates and among NEG DO-RIP-seq replicates were each stronger than correlations between HuR and NEG, indicating high specificity in transcriptomic sites between HuR-bound fragments and the quantified background.
Next we identified HuR binding sites by quantifying local enrichment values of HuR-bound reads over read values from the corresponding negative IP at 5-nt intervals across the transcriptome. A histogram of these enrichment values produced a bimodal distribution similar to that observed for mRNA enriched in prior RIP-chip studies (Supplemental Fig. S2A; Mukherjee et al. 2009). Similar to RIP-chip, we applied Gaussian mixture modeling (GMM) to distinguish the enriched set. GMM was used to calculate the probability of association for each 5-nt bin using log of odds (LOD) scores (Mukherjee et al. 2009). Then we calculated P-values to determine 5-nt bins that were reproducibly enriched for HuR reads versus negative reads among the biological replicates. Finally, to identify binding sites, we selected bins with LOD values greater than zero (i.e., a greater probability of belonging to the HuR mixture than the negative mixture) and P-values less than 0.05, and if three or more consecutive 5-nt bins met these criteria, the bins were merged to define the binding site (Supplemental Fig. S2B). This produced a total of 373,845 reproducible transcriptome binding sites for HuR in HEK293 cells (Supplemental Fig. S2C). Among the identified binding sites were many reported in previous studies, such as CCND1 3′UTR (Fig. 2A; Supplemental Fig. S3A), p27/CDKN1B 5′UTR (Supplemental Fig. S3B), p21/CDKN1A 3′UTR (Supplemental Fig. S3C), and MYC 3′UTR (Supplemental Fig. S3D; Levine et al. 1993; Gao and Keene 1996; Kullmann et al. 2002; Lal et al. 2004). These sites were also identified previously using traditional biochemical and molecular biology techniques. Some of these targets (e.g., CCND1 and p27) were not reproduced in all HuR PAR-CLIP studies; however, all were reproduced by DO-RIP-seq (Supplemental Fig. S3). Also, these sites had much lower read depth (measured in reads per million, RPM) in PAR-CLIP compared to DO-RIP-seq in most cases (Supplemental Fig. S3). This suggests that the greater coverage offered by DO-RIP-seq allows for greater detection and reproducibility (Supplemental Fig. S3). Additionally, we successfully performed DO-RIP-seq experiments for HuR in mouse cells and identified many of the same sites in mouse as we observed in human (Smola et al. 2016). While producing more HuR binding sites than reported in any other study, the locations and nucleic acid sequence characteristics were similar to previous observations (Levine et al. 1993; Gao et al. 1994; Ma et al. 1996; Lebedeva et al. 2011; Mukherjee et al. 2011). For example, the majority of HuR binding sites were in introns and 3′UTRs of mRNA (Fig. 2B), and U-rich motifs were most frequently observed in the binding sites (Fig. 2C).
FIGURE 2.

(A) HuR DO-RIP-seq binding site (red bar and shading) in the CCND1 mRNA 3′UTR in comparison to the binding site deduced by a previous study (green bar and shading) using deletion analysis (Lal et al. 2004). The log of odds score (LOD) and read depth in reads per million (RPM) are depicted. (B) A comparison of the abundance of HuR binding sites in locations across the transcriptome ([3′UTR] 3′ untranslated region, [5′UTR] 5′ untranslated region, [CDS] coding sequence exons, [ncRNA] noncoding RNA). (C) Sequence logo of the most frequently observed cDNA nonamer in HuR binding sites. (D) CDF plot comparing log2 fold-change in mRNA expression following HuR siRNA knockdown for HuR targets identified by DO-RIP-seq, PAR-CLIP, both, or neither. A rightward shift in the curves suggests a greater proportion of regulated targets because HuR is proposed to generally stabilize mRNAs. Targets identified in both techniques (DO-RIP-seq and PAR-CLIP) appear to identify the largest proportion of regulated targets, while targets only identified by DO-RIP-seq (not PAR-CLIP) outperform targets only identified by PAR-CLIP (not DO-RIP-seq) or not identified as targets by either technique. siRNA data are from Mukherjee et al. (2011). (E) HuR binding site saturation analysis. The fractions of significantly enriched (P-value < 0.05) HuR binding sites were plotted for different percentages (10%, 30%, 50%, 70%, and 90%) of random sampled HuR DO-RIP reads. Black line indicates expected trend for completely unsaturated set. Colored points indicate the fraction of binding sites with LOD scores greater than the associated value. (F) Cumulative percentage of all HuR binding sites for sites with LOD scores greater than associated value. Colors match colors from panel E to indicate the cumulative percentage for each saturation curve. (G) Area under the curve analysis testing how well site accessibility predicts binding by HuR comparing DO-RIP or PAR-CLIP data. Red line is DO-RIP-Seq, blue line is PAR-CLIP, and dashed green line is x = y.
Next we sought to demonstrate that sites identified by DO-RIP-seq are functional sites and evaluate how DO-RIP-seq identified HuR targets compared to PAR-CLIP identified HuR targets. To do this, we compared HuR mRNA targets identified by DO-RIP-seq to changes in mRNA abundance following HuR siRNA knockdown. We used previously published knockdown data from the same cell lines (HEK293) (Mukherjee et al. 2011). We classified all expressed mRNAs as targets identified by both DO-RIP-seq and PAR-CLIP, as targets only identified by DO-RIP-seq, as targets only identified by PAR-CLIP, or as mRNAs not identified as targets by either technique (PAR-CLIP targets were taken from the same publication as the siRNA data [Mukherjee et al. 2011]). We compared these groups of mRNAs by cumulative distribution function plots (Fig. 2D). Since HuR is proposed to generally stabilize target mRNAs, we would expect to see a rightward shift in the plot, thus representing greater mRNA abundance in the control knockdown versus the HuR siRNA knockdown. We observed that HuR targets identified by both techniques showed the greatest rightward shift with targets identified by DO-RIP-seq only following closely in second. HuR targets identified by PAR-CLIP only showed a modest but significant difference from mRNAs not identified as targets by either technique. This result shows than in general HuR targets identified by DO-RIP-seq are more functionally responsive to siRNA knockdown than non-targets. Furthermore, it appears that DO-RIP-seq is able to identify additional functionally responsive target mRNAs that are missed by PAR-CLIP.
Together, this demonstrates that DO-RIP-seq can identify transcriptome-wide, functional HuR binding sites and that these sites are similar to those previously reported with the notable distinction that DO-RIP-seq has identified many more HuR binding sites. Furthermore, we have also successfully identified binding sites for the RBPs RBM38, TRA2B, and CELF1 using DO-RIP-seq, and identified sequence motifs and known binding events similar to previous reports (data not shown).
Saturation of binding definitively confirms that HuR binds unstructured/accessible RNA sites
The increased number of binding sites for HuR directed us to test whether we have identified a complete set of HuR binding sites. To do this, we performed a saturation analysis to compare the percentage of binding sites identified when randomly sampling proportions (10%, 30%, 50%, 70%, and 90%) of our aligned sequence reads (Fig. 2E). We sampled reads for each of the three replicates and calculated binding sites using the same binning and mixture model approach with the same criteria as detailed for the full data sets. Extrapolating from the saturation curve, it is evident that additional sequencing would not produce proportionally more HuR sites in HEK293 cells. This is especially pronounced for sites with higher LOD scores. This saturation analysis suggests that we have identified nearly all strong HuR binding sites and a large proportion of all HuR sites (Fig. 2E,F) in the given cell line and condition.
Another use of our data is to understand structural features surrounding sequence motifs that are required for binding; in other words, the accessibility of the site. In order to identify structural features of bound sites, we also need to be able to identify “nonbound” HuR sites. Given that HuR is a sequence specific RBP, a nonbound site is characterized as one that contains an expressed U-rich motif but is not detected as a binding site in our data. Another interpretation of “nonbound” would be that they were bound sites not detected due to insufficient sequencing. However, this is less likely to be the case because we have empirically determined that deeper sequencing would not have yielded more binding sites in proportion to the sequencing depth (Fig. 2E). To determine whether local secondary structure precludes binding by HuR, we defined a HuR motif from DO-RIP-seq binding sites using a k-mer approach (Fig. 2C). We then searched for this motif among expressed 3′UTRs and classified each motif as either bound (LOD > 0) or nonbound (LOD ≤ 0). To calculate the probability of the motifs occurring in localized structured regions, we examined each binding site plus 150 nt of the surrounding sequence and calculated site accessibility using the RNAplfold program (Bernhart et al. 2006). Finally, we used “area under the receiver operating characteristic analysis” (ROCR package in R) to evaluate how well local site accessibility predicted binding. As shown in Figure 2G, site accessibility was a stronger predictor of HuR binding when using DO-RIP-seq than for our previous HuR PAR-CLIP data (Friedersdorf and Keene 2014). This finding corroborates previous studies in concluding that HuR binds to specific sequences in unstructured regions of RNA (Meisner et al. 2004; Li et al. 2010). Taken together, these data show that increased sequence coverage allows for the unique ability of DO-RIP-seq to identify most of the strong binding sites, and thus also identify meaningful nonbound sites as demonstrated by the presence of local secondary structure surrounding nonbound sites. Also, it demonstrates that DO-RIP-seq preserves the local binding preferences for an RBP in the cell because we detected expressed, nonbound sites containing HuR motifs, and these were predominantly in structured regions.
DO-RIP-seq binding scores correlate with binding strength and motif frequency
Since the LOD scores represent binding site enrichment, we decided to test the relationship between the LOD score and binding strength. As an example, we selected four distinct sites within a specific mRNA (β-actin/ACTB) that has a wide range of LOD scores (Fig. 3A). Two of the selected sites (sites #1 and #4) have high LOD values, another (site #3) falls below the median LOD score, and the final site (site #2) was the lowest of the four, with a LOD score in the bottom 1.5% of all global HuR binding sites. In addition, HuR's binding to site #4 was previously shown to result in stabilization of the mRNA (Dormoy-Raclet et al. 2007). For comparison, REMSA was performed with various amounts of HuR protein, incubated with radioactive probes from each site, and analyzed on nondenaturing polyacrylamide gels. The result was a strong correlation between the DO-RIP-seq LOD scores and apparent mobility shifts of the corresponding probes (Fig. 3B). This experiment suggests that LOD scores of global protein–RNA interactions quantified using DO-RIP-seq directly reflect relative differences in binding strength at specific RNA sites in the cell, although tests of additional mRNAs will be needed to generalize this conclusion.
FIGURE 3.

(A) Comparison of four HuR binding sites detected in the 3′UTR of β-actin (ACTB) mRNA. The read depths of the sites are displayed in reads per million (RPM) and the calculated LOD scores for each site are depicted. Note that each binding site shown in red has a corresponding LOD score that suggests sites 1 and 4 have the highest probability of binding. (B) Images of RNA electrophoretic mobility shifts using radiolabeled RNA probes representing each of the four potential binding sites in ACTB. Note that the degree of each shifted band (HuR-probe complex) visually correlates with the LOD score for that site. (B) Bound, (B′) Bound, second shift, (U) Unbound. (C) A series of U-rich binding motifs and their frequency of enrichment in HuR binding sites, grouped by LOD score. Note that the direction of increasing motif frequency with increasing LOD score reverses with the two bottom motifs. (D) A correlation heat map between HuR DO-RIP-seq binding site LOD scores and the sum of Z-scores from HuR 7-mer motifs enriched in RNAcompete. Pearson's R correlation = 0.4996. Colors from blue to red represent increasing density of HuR binding sites. The coordinates with the greatest density of binding sites contribute the most to the R correlation value. RNAcompete data are from Ray et al. (2009).
Assuming that LOD scores indicate the binding strength of HuR, certain specific sequence characteristics associated with HuR binding would be expected to demonstrate higher scores. To address this question, we analyzed HuR DO-RIP-seq binding sites for trends between the frequencies of different U-rich submotifs and LOD scores. We selected potential LOD score cutoffs to produce five binding site groupings that were each ∼20% of all sites (Supplemental Fig. S4A) and enumerated all possible 7-mers. We grouped 7-mers that were similar (the submotifs) and calculated how frequently they were observed among the LOD score groups. The result was that AU-rich submotifs had increasing frequencies at higher LOD scores, while CU- and GU-rich submotifs had decreasing frequencies at higher LOD scores (Fig. 3C; Supplemental Fig. S4B). Note that each LOD score group contained some proportion of each of the U-rich submotifs, and that many of our binding sites contained combinations of these submotifs. This raised the question as to how submotif combinations relate to LOD scores for binding sites. We hypothesized that binding sites with combinations of preferential motifs for HuR binding would have higher LOD scores. We tested this hypothesis using RNAcompete Z-scores of 7-mer motifs for HuR, where a Z-score is an empirical value that measures the preference of recombinant HuR for the 7-mer in an in vitro reaction (Ray et al. 2009). A comparison of the summation of 7-mer Z-scores at binding sites and the DO-RIP-seq LOD score yielded a good correlation; Pearson's R = 0.4996 (Fig. 3D). Therefore, we conclude that HuR binding sites with high LOD scores contain combinations of preferential sequence motifs. However, it should also be noted that while there is a good correlation between DO-RIP-seq LOD scores and in vitro binding measurements, the relationship is not perfect. We believe that at least some of these differences can be attributed to the differences between HuR binding under cellular conditions (DO-RIP-seq) versus in vitro binding (RNAcompete). Taken together, we have quantitatively identified cellular binding sites of HuR to distinguish sites of strong interactions that are partially based on frequencies of particular RNA submotifs.
Using DO-RIP-seq to quantify whole-transcript targets of HuR
RNA binding proteins bind to local sites within mRNA or pre-mRNA and these local binding events ultimately decide the fate of the whole transcript. While whole transcripts can be defined as RNA targets based on whether they contain a single mRNA binding site, it is more robust to define RNA targets by quantifying binding of the whole transcript by the ratio of RBP binding relative to a negative control (Tenenbaum et al. 2000; Morris et al. 2008; Mukherjee et al. 2009). The demonstration that negative DO-RIP-seq controls have good coverage of the transcriptome led us to believe that the negative background binding could be used to quantify whole mRNA targets as is done with RIP-chip experiments when used to normalize transcript abundance. Therefore, whole-transcript targets of HuR were quantified by summing up all reads in each mature transcript, including reads at binding sites as well as background reads, and normalizing the abundance of reads in the HuR DO-RIP-seq against the NEG DO-RIP-seq. This produced a distribution of enrichment scores for transcripts that we call RIP-Seq-Like scores (RSL score, Fig. 4A). Interestingly, the distribution of RSL scores appears to be bimodal, similar to the bimodal distributions seen in RIP-chip enrichment values. Furthermore, the depleted distribution (leftmost) consists mostly of transcripts that do not have any DO-RIP-seq (not shown) or PAR-CLIP HuR binding sites (Fig. 4A), while the enriched distribution (rightmost) consists of transcripts that contain many DO-RIP-seq or PAR-CLIP HuR binding sites. To evaluate whether RSL scores are quantitatively similar to enrichments in undigested, whole-transcript RIPs, we performed HuR RIPs followed by quantitative real-time PCR (RIP-rtPCR) for 28 randomly selected transcripts representing the whole range of RSL scores (from the most enriched to the most depleted). We observed strong correlations between RSL scores and RIP-rtPCR scores with a Pearson's R = 0.72 (Fig. 4B). Also, many of these targets displaying low enrichments (bottom left of the graph) were ones that had no PAR-CLIP binding sites (Fig. 4B), showing the qualitative agreement between the methods. In addition, we compared RSL scores to HuR RIP-chip derived LOD scores from our previous experiments (Mukherjee et al. 2011). The LOD scores used in RIP-chip are analogous to LOD scores from DO-RIP-seq but with the distinction that RIP-chip LOD is a probabilistic measure of whole-transcript enrichment rather than binding site enrichment. We compared the RSL values to the RIP-chip LOD scores by using a cumulative distribution function of RSL scores for groupings of increasing LOD scores. This revealed a strong relationship between RSL and RIP-chip LOD with increasing LOD score groups having higher RSL scores (Fig. 4C). This indicates that the range of whole-transcript enrichments we observed using DO-RIP-seq is similar to those found by our RIP-chip procedure. This observation suggests that the sum of all binding sites from digested RIPs is quantitatively very similar to enrichments seen for whole transcripts and that each site proportionally affects the targeting of the whole transcript. However, as demonstrated below, identification of specific binding sites, as well as whole transcripts, is exceedingly important for understanding the impact of combinatorial binding factors on the functions of each mRNA species.
FIGURE 4.

(A) RSL score distribution for mRNA expressed in HEK293. The distribution for transcripts having 0 HuR PAR-CLIP (0 PC) sites and 8 or more (8+) PC sites is merged with the RSL score distribution. HuR PAR-CLIP data are from Mukherjee et al. (2011). Note the separation of the distributions for the 0 PC sites and 8+ PC sites. (B) Correlation between RSL score and RIP-rtPCR enrichment score for mRNA representing RSL score distribution is strong (Pearson's R = 0.72). Red points are genes with HuR sites according to PAR-CLIP, and black points are genes with no HuR sites according to PAR-CLIP. (C) Cumulative distribution functions displaying the RSL score distribution for genes grouped by the HuR RIP-chip LOD score. Red, high RIP-chip LOD; green, medium RIP-chip LOD; blue, low RIP-chip LOD; black, very low RIP-Chip LOD. The RIP-Chip LOD agrees with the DO-RIP RSL score.
DO-RIP-seq identifies enriched functional gene sets and overlapping binding sites
To determine whether whole-transcript enrichments from DO-RIP-seq experiments can identify functional gene sets, we performed a Gene Set Enrichment Analysis using RSL analysis data. Similar to previous observations from HuR RIP-chip (Mukherjee et al. 2009), we observed that HuR targets were significantly enriched for many predicted microRNA (miR) target gene sets (Fig. 5A). While the majority of predicted miR target gene sets were enriched, there were some miR target gene sets that were not significantly enriched (Supplemental Table S1).
FIGURE 5.
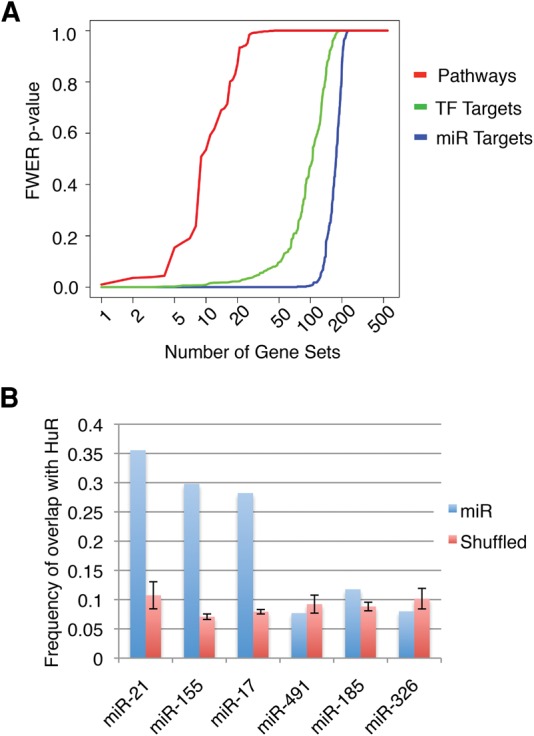
(A) A comparison of the number of gene sets obtained from GSEA using HuR DO-RIP-seq mRNA target analysis. Note the large number of significantly enriched microRNA target gene sets (miR Targets, blue) compared to transcription factor target gene sets (TF Targets, green), and canonical biological pathway gene sets (Pathways, red) based on their FWER (family wise error rate) based on P-values for normalized enrichment. FWER < 0.1 is considered significant. (B) The frequency of overlap between predicted miR sites and HuR binding sites compared with the frequency of overlap between predicted miR sites shuffled on 3′UTRs and HuR binding sites from DO-RIP-seq data. The miRs shown are representative of those having gene sets significantly enriched (miR-21, miR-155, miR-17), and not significantly enriched (miR-326, miR-185, miR-491) in HuR DO-RIP-seq mRNA target analysis.
Given that HuR can antagonize AGO-miR functions when bound close to AGO-miR binding sites (Mukherjee et al. 2011; Lu et al. 2014), we used our binding site data to test whether HuR binds within 10 nt of a miR site at frequencies that were greater than that of a shuffled miR set. We selected miR-21, miR-155, and miR-17-5p as candidates whose targets were significantly enriched in HuR DO-RIP-seq, and miR-185, miR-326, and miR-491 as candidates having no significant enrichment in HuR DO-RIP-seq. We observed that HuR bound near the enriched miR seed sites (miR-21, miR-155, and miR-17-5p) at frequencies greater than that of the shuffled miRs, i.e., greater than random (Fig. 5B). However, the frequencies for HuR binding close to the nonenriched miR seed sites (miR-185, miR-326, and miR-491) were approximately the same as shuffled miR sites (Fig. 5B). Given that HuR has been found to generally stabilize mRNA targets while AGO-miR binding is associated with decay of targeted mRNAs, it has been proposed that antagonism of AGO function by HuR may control the turnover of HuR mRNA targets (Mukherjee et al. 2011; Lu et al. 2014). These results support the conclusion that whole-transcript target analysis using DO-RIP-seq can reveal functionally related RNA targets and, together with binding site information, illuminate the importance of combinatorial relationships among RNA-binding proteins at the binding site level.
DISCUSSION
Quantification of protein–RNA interactions with DO-RIP-seq in comparison to other procedures
Among the goals of this work was to quantify cellular RBP binding sites using our traditional RIP method and to relate quantitative binding site values to those of whole-transcript targeting. On the other hand, one of the challenges of quantifying cellular binding using CLIP procedures has been the necessity to consider RNA abundance, because unlike DNA that uses chromatin immunoprecipitation (ChIP) procedures, each RNA copy number per cell is variable. Thus, one must account for the variations in RNA abundance to assess quantitative relationships among RNA targets of a RBP. However, RIP techniques have consistently addressed this problem by measuring background levels based on a negative IP control. This allows one to calculate enrichment by normalizing transcript abundance in the positive IP to the background IP, thus accounting for differences in RNA abundance (Morris et al. 2008; Mukherjee et al. 2009; Uren et al. 2012; Kucukural et al. 2013). In developing DO-RIP-seq, we went further by normalizing local regions against background to quantitatively determine binding site enrichment. It is possible that some negative IP's may introduce biases such as the binding of aptameric RNAs to antibodies. However, we have found that our antibody-based approach to identify and quantify binding was complemented by nonantibody-based Delta-SHAPE experiments determining RBP binding sites in XIST lincRNA (Smola et al. 2016). This suggests that antibody-based biases have a negligible effect on DO-RIP-seq binding sites. Nevertheless, as an alternative to negative IPs, input RNA could also be utilized by making libraries taken from the same RNase-treated lysate used in the IP and prepared using the same cDNA library protocol. We have found that aligned reads from negative IPs correlate well with “input” RNA, making inputs a suitable alternative (data not shown).
Although at their inception CLIP techniques did not attend to background (Ule et al. 2003, 2005; Hafner et al. 2010; Konig et al. 2010), it has since been shown that significant background remains in CLIP experiments (Friedersdorf and Keene 2014) and that accounting for it greatly improves identification of binding sites (Jangi et al. 2014; Reyes-Herrera et al. 2015; Conway et al. 2016; Galloway et al. 2016; Holmqvist et al. 2016; Van Nostrand et al. 2016). However, it is not known whether this is due to improved signal-to-noise detection or whether the difference in enrichment represents quantitative differences in binding to various submotifs (Kishore et al. 2011; Lambert et al. 2015; Conway et al. 2016). Some CLIP experiments have interpreted binding measurements as quantitative; however, those experiments have not formally demonstrated a direct relationship between CLIP enrichment and binding strength (Zarnack et al. 2013). Here we have shown that by comparing local enrichment of binding sites over negative IPs, we can generate a continuously distributed and quantitative value for each binding site, i.e., a LOD score. We have shown that the values of these LOD scores are directly related to in vitro binding strength.
Several in vitro methods have been developed recently to quantify binding to short stretches of RNA in vitro (Campbell and Wickens 2015). For example, RNA Bind-n-Seq calculates dissociation constants in vitro for canonical and noncanonical motifs that can be bound by an RBP, and it has been used to complement CLIP in order to distinguish functional sites from nonfunctional sites in CLIP data (Lambert et al. 2014). While DO-RIP-seq LOD scores show a relationship with in vitro binding strength, they are not dissociation constants, as we could not incrementally vary the amount of HuR in the cell in our experiments. However, DO-RIP-seq enrichment values represent relative binding strength as it occurs in the cell. Importantly, we showed that HuR LOD scores are the result of the combination of multiple preferential motifs within the site. Furthermore, our HuR binding sites displayed a consistent trend between the frequency of optimal submotifs and LOD scores, suggesting that in cells HuR may have a slight preference for particular submotifs. Since other in vitro studies suggest that there is no preference for HuR binding to these submotifs, this may reflect cellular combinatorial interactions with other RNA-binding proteins.
The importance of RNA binding site saturation
The number of HuR binding sites identified with DO-RIP-seq approached full transcriptome saturation for sites with higher LOD scores. We also demonstrated that higher LOD scores correlate well with strength of binding. Together, this indicates that deeper sequencing would not yield proportionally more of these stronger binding sites, and thus, we were able to identify nearly all strong, DO-RIP-seq detectable HuR binding sites in HEK293 cells. We believe the reason DO-RIP-seq can achieve binding site saturation is the relatively high-efficiency immunoprecipitation of native RNPs versus using UV-cross-linked immunoprecipitations. This improved efficiency is evident when comparing the number of PCR cycles needed for DO-RIP-seq versus various CLIP protocols; with DO-RIP-seq requiring between 11 and 14 cycles, while lower efficiency CLIP typically requires cycle numbers in the mid to upper 20 sec (Van Nostrand et al. 2016). However, it should be noted that even with the improved efficiency of DO-RIP-seq, we may not have been able to saturate all binding sites, especially the weak and possibly transient HuR-RNA interactions. Furthermore, some classes of binding sites were more reticent to saturation; for example, intronic binding sites were less saturated than exonic sites because of the lower abundance and higher turnover of introns relative to exons. Nevertheless, we showed how this saturation of DO-RIP-seq binding sites allowed better discrimination of bound versus nonbound motifs as evidenced in the predictive relationship between binding and lack of RNA secondary structure (Fig. 2E,G), and in uncovering additional functionally responsive target mRNAs (Fig. 2D).
We have only tested for saturation with HuR, so we cannot say for certain whether other RBPs will show similar completeness. However, given HuR's pervasive binding across the transcriptome, it is reasonable to believe that other RBPs will be similar or better than HuR in terms of saturation. Furthermore, the first two sequence runs were under-sequenced (26M and 47M uniquely mapped reads) compared to the third replicate (80M uniquely mapped reads) due to an artifact affecting sequencing depth, as explained in Materials and Methods. This was addressed in the third run and resulted in significantly more reads. Thus future runs should lead to greater sequence depth and greater overall saturation.
We believe that the ability of DO-RIP-seq to accurately distinguish bound motifs from nonbound motifs will pave the way for further discovery of more subtle sequence characteristics that influence RBP binding in cells. For example, it may be possible to find spatial relationships between bound and nonbound motifs of two different RBPs to uncover cooperative or competitive interactions between the RBPs in cells. Also, we suggest that saturation will be useful when studying RBP binding during dynamic biological processes or responses to perturbations. Dynamic conditions can modulate the binding of a RBP, resulting in partial to complete loss or gain in binding. Moreover, these dynamic conditions affect transcript abundance. By saturating the binding site detection, one has more confidence that changes in binding observed at specific sites are truly due to a biological rather than a technical feature. In addition to accounting for transcript abundance using a negative control IP (or matched input), and being able to quantify binding using scores like a LOD, we expect that DO-RIP-seq experiments can robustly detect and quantify biologically significant binding site changes in cells and tissues.
Utility of whole-transcript analysis
An unexpected but gratifying application of DO-RIP-seq is the ability to quantify RNA binding sites as well as whole-transcript targets of HuR. In this study, we found that the normalized aggregate of the enrichments of all binding sites across the transcripts (i.e., RSL scores) is proportional to the enrichment of whole, undigested transcripts (Fig. 4B). While knowing the sites of RBP binding may be essential for understanding the mechanisms of regulation, the functional outcome in the cell is determined on the level of the whole transcript; thus it is important to be able to relate binding sites to whole-transcript binding. Moreover, having a quantitative relationship between sequence-specific binding events and the whole message makes DO-RIP-seq data amenable to integration with other globally quantifiable methods like transcriptomic profiling, metabolic labeling of RNA, ribosome profiling, and Delta-SHAPE-MaP. Although the identification of RNA binding sites using CLIP techniques has been used to define whole-transcript “RNA targets,” one can only speculate as to how often or how strongly these sites are bound per transcript. We think that DO-RIP-seq whole-transcript target analysis provides a way to quantitatively identify functional targets while providing the sites that impact regulation of the transcript.
Using the DO-RIP-seq procedure to distinguish functional relationships at the whole-transcript and binding site levels
The functional interplay between HuR and miRs has been particularly interesting because they appear to have competing effects on RNA targets, namely, RNA stabilization and destabilization, respectively. Over the past several years there have been reports of HuR's antagonistic as well as synergistic effect on miR function on a single mRNA (Meisner and Filipowicz 2011; Srikantan et al. 2012). However, evidence from transcriptome-wide studies suggests that HuR antagonizes the destabilizing effect of miRs when bound at overlapping binding sites (Mukherjee et al. 2011; Lu et al. 2014). We found that HuR's binding sites residing within 10 nt of enriched miR target gene sets overlap predicted miR binding sites at frequencies greater than expected (Fig. 5B). This suggests that miR mRNA targets are most likely to be bound by HuR near the miR site and to antagonize AGO-miR function. However, not all predicted miR sites overlapped with HuR sites at rates greater than random. These outlying miR target sets contained transcripts that were depleted in HuR RNPs and contained significantly fewer 3′UTR binding sites. Given that HuR and miRs have roles in overlapping processes like cell cycle, apoptosis, and angiogenesis, the functional interplay between the two is likely to be essential in these biological processes (Bushati and Cohen 2007; Abdelmohsen and Gorospe 2010).
In summary, DO-RIP-seq is a novel methodological approach that provides quantitative scores for comparisons of whole-transcript targeting as well as in cell binding site strengths of RBPs. This approach is useful for quantifying changes in RBP binding events at the whole-transcript and binding site levels in response to environmental signals and perturbations while also allowing for more complete integration with gene regulation data. Another compelling reason to use this approach in comparison to cross-linking methods is that it preserves important biological information contained within protein–RNA interactions that evolved to be noncovalent and represent a unique biological state of gene expression. When these subtle combinations of bonds are overridden by covalent bonds inserted by cross-linking the RNA-binding protein to the RNA, much of the biological essence is lost. Therefore, our RIP procedures preserve most of the noncovalent properties of protein–RNA interactions and enrich our ability to observe the dynamic biological changes inherent to a functional post-transcriptional outcome.
MATERIALS AND METHODS
Adapters and primers for HuR.1 and Neg.1 DO-RIP-seq libraries
5′ RNA adapter: GUUCAGAGUUCUACAGUCCGACGAUC
3′ DNA adapter: /5rApp/NNNNNTCGTATGCCGTCTTCTGCTTG/3ddC/
5′ PCR DNA primer: AATGATACGGCGACCACCGACAGGTTCAGAGTTCTACAGTCCGA
3′ PCR DNA primer: CAAGCAGAAGACGGCATACGA
Adapters and primers for HuR.2 and Neg.2 DO-RIP-seq libraries
5′ RNA adapter: GUUCAGAGUUCUACAGUCCGACGAUC
3′ DNA adapter: /5rApp/NNNNNTCGTATGCCGTCTTCTGCTTG/3ddC/
5′ PCR DNA primer: AATGATACGGCGACCACCGACAGGTTCAGAGTTCTACAGTCCGA
3′ PCR DNA primer for HuR.2: GTCAAGCAGAAGACGGCATACGA
3′ PCR DNA primer for Neg.2: ACCAAGCAGAAGACGGCATACGA
Adapters and primers for HuR.3 and Neg.3 DO-RIP-seq libraries
5′ RNA adapter: GUUCAGAGUUCUACAGUCCGACGAUC
3′ DNA adapter: /5rApp/NNNNNAGATCGGAAGAGCACACGT/3ddC/
5′ PCR DNA primer: AATGATACGGCGACCACCGACAGGTTCAGAGTTCTACAGTCCGA
First-strand synthesis DNA primer: ACGTGTGCTCTTCCGATCT
3′ HuR.3 Index primer: CAAGCAGAAGACGGCATACGAGATGTGACGAGTTCATTGGCACGTGTGCTCTTCCGATCT
3′ Neg.3 Index primer: CAAGCAGAAGACGGCATACGAGATGTGACGAGTTCTACAAGACGTGTGCTCTTCCGATCT
All oligonucleotides were ordered from Integrated DNA Technologies. The adapter and primer sequences were adopted from Hafner et al. (2008). The 3′ adapters included random 5-nt sequences to distinguish unique copies from PCR duplicates (Kivioja et al. 2012).
Cell culture and lysate preparation
HEK293 cells were grown in 10 × 15-cm dishes until they were 80%–90% confluent (approximately 12 × 106 cells per dish). Cells were harvested by first removing the growth media and then harvested directly into cold PBS by scraping. Cells were washed once with ice-cold PBS and then lysed on ice by resuspending and repeated pipetting with 1.5 cell pellet volumes of polysome lysis buffer (10 mM HEPES [pH 7.0], 100 mM KCl, 5 mM MgCl2, 5 mM CaCl2, 1× cOmplete protease inhibitor cocktail [Roche], 100 Units/mL RNaseOUT [Life Technologies], 0.5% IGEPAL, and 1 mM DTT). Lysates were incubated on ice for 5 min and then stored at −80°C.
Preparation of protein G beads
Magnetic protein G beads (Life Technologies) were prepared by removing the bead storage buffer and then resuspending the beads in NT2 buffer (50 mM Tris–HCl, 1 mM MgCl2, 150 mM NaCl, 0.05% IGEPAL). The protein G beads were incubated with saturating amounts of mouse anti-HuR (3A2) monoclonal antibodies, or with normal mouse serum antibodies at room temperature for 20 min or overnight (∼18 h) at 4°C. Before antibody bead complexes were used for immunoprecipitation, they were washed three times with cold NT2 buffer.
It is important to note that we are not aware of any published data using our RIP procedure that demonstrated or reported post-lysis RNA reassortment (Tenenbaum et al. 2002; Keene et al. 2006). In fact, in an extensive and rigorous test of our procedure using mixed human and mouse cell lysates, we did not detect any RNA reassortment (Penalva et al. 2004). At approximately the same time of publication, a paper by Mili and Steitz (2004) reported post-lysis binding of a tagged c-fos mRNA in one cell type with a tagged HuR protein in another cell type also by using mixed cell lysates. Importantly, the most significant difference between the two methods was that Mili and Steitz used a lysis procedure that included sonication, while our mRNA RIP procedure did not use sonication but was intentionally gentle to avoid fragmentation of mRNAs and mRNPs. Sonication is an extremely disruptive procedure that breaks covalent and noncovalent bonds and shears nucleic acids and proteins. Thus, it was not surprising to find post-lysis reassortment when using sonication in RIP procedures as reported by these studies (Mili and Steitz 2004; Riley and Steitz 2013). Indeed, the design of the original RIP procedure was to minimize post-lysis reassortment of messenger RNAs by using polysome lysis buffer followed by immediate freezing (Tenenbaum et al. 2000), while noting that sonication is explicitly not to be used as clearly stated in several publications (Tenenbaum et al. 2000; Keene et al. 2006; Morris et al. 2008; Mukherjee et al. 2009, 2011). To the best of our knowledge, there are no publications that have reported post-lysis reassortment using our published RIP procedures.
Optimization of digestion conditions with micrococcal nuclease
Six 15-cm dishes of HEK293 lysates were prepared using conditions described above. Frozen cell lysates were thawed on ice and cleared by centrifugation at 15,000g, 4°C for 15 min. After clearance the cell lysates were pooled together. Of the total pooled lysate volume, 10% was set aside to measure total RNA concentration before treatment with micrococcal nuclease (New England BioLabs). The remaining lysate was divided into six equal volumes, and each was increased to a final volume of 300 µL using polysome lysis buffer. Next the lysates were incubated at 30°C for 5 min with increasing amounts of micrococcal nuclease and also without micrococcal nuclease. Ratios of micrococcal nuclease (gel Units) to total RNA (µg) tested were 0, 1, 5, 18, 73, and 294 gel Units/µg. The micrococcal nuclease was inactivated by adding EGTA to a final concentration of 10 mM (a 2:1 molar ratio of EGTA to CaCl2). Immunoprecipitations were performed with magnetic protein G beads coupled to mouse anti-HuR (3A2) monoclonal antibodies. Immunoprecipitations were performed in a final reaction volume that was 8× the lysate volume using NT2 buffer supplemented with 100 units/mL RNaseOUT, 20 mM EDTA, and 1 mM DTT. Immunoprecipitation reactions were incubated at 4°C for 2 h with constant mixing. Afterward the bead complexes were washed four times with ice-cold NT2 buffer, and the RNA was extracted using the TRIsure reagent (Bioline) per the manufacturer's protocol.
Extracted RNA was treated with 1 unit of recombinant shrimp alkaline phosphatase (rSAP, New England BioLabs) in 10 µL reaction volumes containing 1× CutSmart buffer (New England BioLabs). The rSAP was inactivated by incubating at 65°C for 5 min, and then the reactions cooled on ice. Next, the RNA was radiolabeled with 0.5 µL of 6000 Ci/mmol [γ-P32]ATP (Perkin Elmer), 1× T4 polynucleotide kinase buffer (New England BioLabs), and 10 units of T4 polynucleotide kinase (New England BioLabs) in a final reaction volume of 20 µL for 30 min at 37°C. One volume of 2× gel loading buffer II was added to each reaction, and then they were incubated for 30 sec at 95°C and then cooled on ice. The reactions were loaded onto 15% Criterion TBE-Urea polyacrylamide gels (Bio-Rad), and electrophoresis was performed. Gels were exposed to phosphor imager screens and then the screens scanned on a phosphor imager. We selected a condition that would provide a distribution of fragments between 20 and 70 nt as the cDNA sequences made from these are large enough to align uniquely to the genome, yet small enough to resolve binding sites. We calculated the ratio of gel units of micrococcal nuclease to total RNA from the selected condition that gave us the desired sizes, and used this ratio in subsequent experiments. We recommend that this experiment be performed when beginning work on a new RBP and/or cell line.
DO-RIP-seq
As described above, 10 × 15-cm dishes (∼12 × 106 cells per dish) worth of HEK293 lysates were prepared for HuR DO-RIP-Seq. These lysates were thawed on ice and then centrifuged at 4°C to clear the cell debris. The total RNA concentration of the lysate was measured by extracting total RNA from 10% of the cleared lysate using TRIsure reagent per the manufacturer's protocol. The cleared lysates were digested in 300 µL volumes (the volume used in the optimization experiment) using 30 gel Units MNase/μg RNA. As described above, digestions were performed by incubating the lysate with micrococcal nuclease for 5 min at 30°C and inactivating the enzyme by adding EGTA to a final concentration of 10 mM. Digested lysates were pooled and then evenly added to immunoprecipitation reactions with either magnetic protein G beads coupled to mouse anti-HuR (3A2) antibodies, or to normal mouse serum antibodies. Immunoprecipitations were performed at 4°C for 2 h with constant mixing, and then the bead–antibody complexes washed four times with ice-cold NT2 buffer. RNA fragments from the IP were extracted, dephosphorylated, and radiolabeled as described above. Since these RNA fragments were going to be used for cDNA libraries, 10 nmol of nonradioactive ATP was added to the radiolabeling reaction after the 30 min incubation with [γ-P32] ATP and incubated for an additional 10 min at 37°C to ensure complete labeling of the ends. As described above, end-labeled fragments were separated by polyacrylamide gel electrophoresis, and the gel was visualized using a phosphor-imaging scanner. RNA fragments corresponding to 25–70 nt in length were cut from the gel and extracted overnight by constantly mixing the gel slices in 400 µL of 0.4 M NaCl at 4°C. The supernatant containing the radiolabeled RNA fragments was transferred to a new microcentrifuge tube. Two hundred microliters of 0.4 M NaCl was then added to the gel slices and constantly mixed at 4°C for 1 h to wash. The supernatant from the wash was pooled with the supernatant from the overnight extraction, and then RNA fragments were precipitated from pooled supernatants by adding 1 mL of 100% ethanol and 15–45 μg of glycogen followed by incubating at −20°C for at least 1 h or −80°C for 30 min. The RNA fragments were centrifuged at 17,000g, 4°C for 20 min to pellet the RNA. Supernatants were removed, and the pellets were washed once by adding 1 mL of 80% ethanol (v/v). This was followed by centrifugation at 10,000g, 4°C for 5 min, supernatant removal, and air-drying of the pellets.
Ligation of sequencing adapters, first-strand cDNA synthesis, and cDNA amplification
Our preferred method for ligating sequencing adapters, making the first-strand cDNA, and amplifying the final cDNA library is by using the NEBNext small RNA library prep protocol (New England BioLabs). A pilot PCR was run with one-tenth of the final reaction volume to determine the minimum number of PCR cycles needed to make the final libraries for sequencing. Final libraries were prepared by scaling PCR reactions 2×, i.e., reaction volumes were doubled and the amount of cDNA added was doubled. Two of these scaled-up PCR reactions were prepared per sample, which means libraries were scaled up a total of 4×. The numbers of amplification cycles performed to make cDNA libraries from the three biological replicates of HuR DO-RIP were 14, 13, and 11, respectively. The numbers of amplification cycles to make cDNA libraries from the biological replicates of negative DO-RIP were 14, 16, and 14, respectively.
Reactions were pooled accordingly, NaCl was added to a final concentration of 0.3 M, and then 1 volume of basic phenol chloroform isoamyl alcohol (25:24:1, v/v, Invitrogen) was used to extract the nucleic acids, which included the cDNA, primers, and RNA fragments used to make first-strand cDNA. The nucleic acids were precipitated using 2.5 volumes of 100% ethanol and 30 μg of GlycoBlue and incubation at −20°C for at least 1 h or at −80°C for 30 min. Precipitated nucleic acids were centrifuged at 17,000g for 20 min to pellet the RNA, and then the pellets were washed once with 80% ethanol (v/v) and then resuspended in 20 µL of 1× Tris-acetic acid–EDTA buffer (40 mM Tris, 20 mM acetic acid, and 1 mM EDTA).
Agarose gel electrophoresis using 4% low-melt agarose (w/v) was used to separate cDNA fragments from adapter concatamers and other nucleic acids. cDNA fragments corresponding to the size of the RNA fragments plus the size of the ligated adapters were cut and extracted from the gel using QIAquick gel extraction spin column protocol (QIAGEN). Final cDNA libraries were eluted with 40 µL of EB buffer (10 mM Tris–HCl [pH 8.5], QIAGEN) and submitted to the Duke Center for Genomic and Computational Biology for 100 base pair, single read sequencing on Illumina Hi-Seq 2500. In addition, we observed that digestion with micrococcal nuclease produced a majority of fragments that had A as the first nucleotide. This resulted in a drop in sequence quality and lower yields for Hi-Seq runs. Under advisement, we had a dark cycle run performed on the first cycle of sequencing for the third replicated experiment. This resulted in higher yields and greater sequence quality. More recently, we have moved the UMI from the 3′ adapter to the 5′ adapter and this has eliminated the need of performing a dark cycle run.
Processing of raw reads and data analysis
As mentioned above, custom adapter sequences that contained five random nucleotides were used to distinguish PCR artifact from biological duplicate sequences. To process raw reads from the digestion-optimized RIP libraries adapter sequences up to, but not including, the 5-nt, random sequences were removed using Cutadapt. These trimmed reads that still contained the five random nucleotides were then collapsed to unique sequences. The random 5-nt regions were removed and the reads were mapped to the human genome (hg19) using TopHat2. We empirically define whole-transcript association with HuR using a “RIP-Seq-Like” or RSL score. To do this, first we calculated reads per million mapped (RPM) for each known gene (Gencode v19, excluding intronic reads) in the HuR and negative libraries. Then the difference between the logarithmic means for the RPMs of each gene in HuR and the negative was defined as the RSL score of the gene.
To identify binding sites of HuR, uniquely mapped HuR and negative reads were binned in 5-nt intervals across the genome. In cases where either there were reads present in the HuR interval or the negative interval but not in the other, a pseudocount of one was added to the interval with zero reads according to Laplace's rule of succession. Reads were normalized for library size (per million reads) and log2-transformed. Reproducible enrichments of reads in HuR intervals versus matched sample negative intervals were determined by single-tailed paired t-test. A high pass filter was applied where an interval must have at least one sample (HuR or negative, including all replicates) with greater than six reads. The ratios of HuR reads to negative reads for each 5-nt interval (difference of log-transformed normalized counts) were calculated for the mean enrichment across the replicates. Histograms of this log ratio produced a characteristic bimodal pattern of enrichment, with the two apparent distributions consisting of intervals enriched or depleted in HuR versus negative (Supplemental Fig. S2A). To determine the probabilities of each interval belonging to the HuR enriched distribution, mixture models were generated using the “mixtools” package in R as previously described (Mukherjee et al. 2009). The posterior probabilities generated from the mixture model were used to calculate a log of odds ratio or LOD score (log10 of ratio of posterior probabilities). HuR binding sites were defined as three or more consecutive 5-nt intervals with LOD > 0 and P < 0.05.
Transcriptome coverage comparisons
To calculate the transcriptome coverage first, all transcripts were defined as the known gene present in Gencode version 19. These transcripts were filtered for expression in HEK293 cells using mRNA-seq data (Schueler et al. 2014). Expression was categorized as “detectable” if the transcript had an FPKM > 0, “expressed” if the FPKM > 0.1, and “abundant” if the FPKM > 1. Percent coverage of each expression category was then calculated for DO-RIP-seq and PAR-CLIP data sets (HuR and negative IPs from both) using BEDTools (Quinlan and Hall 2010).
Identifying enriched gene sets and binding site relationships
Functional enrichments were calculated using GSEA (Subramanian et al. 2005). A gene set's enrichment was considered significant if it had FDR q-value < 0.05 or family-wise error rate (FWER) < 0.1. Overlapping sites were defined as predicted 7-mer miRNA sites (predicted by TargetScanHuman 5.1 [Lewis et al. 2005, Grimson et al. 2007; Friedman et al. 2009]) within 10 nt of a HuR binding site. The frequency of overlap was defined as the ratio of miRNA seed matches overlapping HuR sites relative to the total number of miRNA seed matches in the genome. Shuffled miRNA sites were produced using only miR sequences shuffled on 3′UTR sequences from protein-coding genes.
Binding site saturation analysis
As described previously (Friedersdorf and Keene 2014), the fraction of binding sites observed was calculated using random samples of mapped reads at depths equivalent to 10%, 30%, 50%, 70%, and 90% of each of the HuR replicate libraries. Binding sites were then calculated as described above for each sampling depth. For each depth these newly determined binding sites from the sampled reads were compared to the binding sites determined from the whole libraries to calculate the fraction of binding sites observed.
RNA electrophoretic mobility shift assays
The following sequences from each of the four β-actin sites were cloned in the pGEM-T vector:
site #1 = 5′-TCGCCTTAATACTTTTTTATTTTGTTTTATTTTGAATGAT-3′
site #2 = 5′-TAAAAGCCACCCCACTTCTCTCTA-3′
site #3 = 5′-CGAGGACTTTGATTGCACATTGTTGTTTTTTTAATAGTC-3′
-
site #4 = 5′-GGCATGGCTTTATTTGTTTTTTTTGTTTTGTTTTGGTTTTTTTTTTTTTTTTGGCTTGA-3′
RNA probes were synthesized in in vitro transcription reactions using T7 polymerase in the presence of α-32P-UTP. The full length coding sequence of human ELAVL1 (HuR) was cloned into a pET vector with a GST-6xHis-Tev tag. Expression of recombinant protein from E. coli (BL21 DE3) was induced with IPTG and purified using GST columns (Smith and Corcoran 2001). REMSA assays were carried out with increasing concentrations of recombinant HuR (from 50 nM to 800 nM), 50 mM Tris (pH 8.0), 80 mM NaCl, 0.05% Triton-X, 5% glycerol, 0.5 mL/mL yeast tRNA, and 250 pM radiolabeled RNA probe in 10 µL reactions. Mixtures were incubated on ice for 30 min and then resolved on nondenaturing 6% polyacrylamide TBE gels. RNA–protein complexes were visualized by phosphor imaging.
RIP-quantitative real-time PCR
HEK293 cell lysates were prepared using polysome lysis buffer as outlined in Keene et al. (2006). Likewise the lysates were used to perform RIPs as outlined in Keene et al. (2006). RNA was extracted from RIPs using TRIsure reagent (Bioline) and used to make cDNA using the iScript cDNA synthesis kit (Bio-Rad). Primer specific real-time PCR (rtPCR) was performed using Platinum SYBR Green qPCR SuperMix-UDG (Thermo Fisher Scientific) and a LightCycler 1.5 instrument (Roche). The rtPCR scores are equivalent to fold enrichments calculated using the ΔΔCT method with the gene COX6B1 as an internal reference (Livak and Schmittgen 2001).
SUPPLEMENTAL MATERIAL
Supplemental material is available for this article.
COMPETING INTEREST STATEMENT
J.D.K. declares a financial relationship with MBL Inc. and Ribonomics Inc.
Supplementary Material
ACKNOWLEDGMENTS
We thank Laura Simone-Bisogno and Jeff Blackinton for their insights and critical reviews of the manuscript. We also thank Olivier Fedrigo for discussions on Illumina sequencing technology. This work was funded by the National Cancer Institute (R01 CA157268 to J.D.K. and 5T32CA009111 to C.O.N.), the National Science Foundation (0842621 to J.D.K.), and the Duke SPORE in Brain Cancer (P50 CA190991 to J.D.K.).
Footnotes
Article is online at http://www.rnajournal.org/cgi/doi/10.1261/rna.058115.116.
REFERENCES
- Abdelmohsen K, Gorospe M. 2010. Posttranscriptional regulation of cancer traits by HuR. Wiley Interdiscip Rev RNA 1: 214–229. [DOI] [PMC free article] [PubMed] [Google Scholar]
- Beisang D, Rattenbacher B, Vlasova-St Louis IA, Bohjanen PR. 2012. Regulation of CUG-binding protein 1 (CUGBP1) binding to target transcripts upon T cell activation. J Biol Chem 287: 950–960. [DOI] [PMC free article] [PubMed] [Google Scholar]
- Bernhart SH, Hofacker IL, Stadler PF. 2006. Local RNA base pairing probabilities in large sequences. Bioinformatics 22: 614–615. [DOI] [PubMed] [Google Scholar]
- Brooks L III, Lyons SM, Mahoney JM, Welch JD, Liu Z, Marzluff WF, Whitfield ML. 2015. A multiprotein occupancy map of the mRNP on the 3′ end of histone mRNAs. RNA 21: 1943–1965. [DOI] [PMC free article] [PubMed] [Google Scholar]
- Bushati N, Cohen SM. 2007. microRNA functions. Annu Rev Cell Dev Biol 23: 175–205. [DOI] [PubMed] [Google Scholar]
- Campbell ZT, Wickens M. 2015. Probing RNA-protein networks: biochemistry meets genomics. Trends Biochem Sci 40: 157–164. [DOI] [PMC free article] [PubMed] [Google Scholar]
- Conway AE, Van Nostrand EL, Pratt GA, Aigner S, Wilbert ML, Sundararaman B, Freese P, Lambert NJ, Sathe S, Liang TY, et al. 2016. Enhanced CLIP uncovers IMP protein-RNA targets in human pluripotent stem cells important for cell adhesion and survival. Cell Rep 15: 666–679. [DOI] [PMC free article] [PubMed] [Google Scholar]
- Dormoy-Raclet V, Menard I, Clair E, Kurban G, Mazroui R, Di Marco S, von Roretz C, Pause A, Gallouzi IE. 2007. The RNA-binding protein HuR promotes cell migration and cell invasion by stabilizing the β-actin mRNA in a U-rich-element-dependent manner. Mol Cell Biol 27: 5365–5380. [DOI] [PMC free article] [PubMed] [Google Scholar]
- Ennajdaoui H, Howard JM, Sterne-Weiler T, Jahanbani F, Coyne DJ, Uren PJ, Dargyte M, Katzman S, Draper JM, Wallace A, et al. 2016. IGF2BP3 modulates the interaction of invasion-associated transcripts with RISC. Cell Rep 15: 1876–1883. [DOI] [PMC free article] [PubMed] [Google Scholar]
- Friedersdorf MB, Keene JD. 2014. Advancing the functional utility of PAR-CLIP by quantifying background binding to mRNAs and lncRNAs. Genome Biol 15: R2. [DOI] [PMC free article] [PubMed] [Google Scholar]
- Friedman RC, Farh KK, Burge CB, Bartel DP. 2009. Most mammalian mRNAs are conserved targets of microRNAs. Genome Res 19: 92–105. [DOI] [PMC free article] [PubMed] [Google Scholar]
- Galloway A, Saveliev A, Lukasiak S, Hodson DJ, Bolland D, Balmanno K, Ahlfors H, Monzon-Casanova E, Mannurita SC, Bell LS, et al. 2016. RNA-binding proteins ZFP36L1 and ZFP36L2 promote cell quiescence. Science 352: 453–459. [DOI] [PubMed] [Google Scholar]
- Gao FB, Keene JD. 1996. Hel-N1/Hel-N2 proteins are bound to poly(A)+ mRNA in granular RNP structures and are implicated in neuronal differentiation. J Cell Sci 109(Pt 3): 579–589. [DOI] [PubMed] [Google Scholar]
- Gao FB, Carson CC, Levine T, Keene JD. 1994. Selection of a subset of mRNAs from combinatorial 3′ untranslated region libraries using neuronal RNA-binding protein Hel-N1. Proc Natl Acad Sci 91: 11207–11211. [DOI] [PMC free article] [PubMed] [Google Scholar]
- Grimson A, Farh KK, Johnston WK, Garrett-Engele P, Lim LP, Bartel DP. 2007. MicroRNA targeting specificity in mammals: determinants beyond seed pairing. Mol Cell 27: 91–105. [DOI] [PMC free article] [PubMed] [Google Scholar]
- Hafner M, Landgraf P, Ludwig J, Rice A, Ojo T, Lin C, Holoch D, Lim C, Tuschl T. 2008. Identification of microRNAs and other small regulatory RNAs using cDNA library sequencing. Methods 44: 3–12. [DOI] [PMC free article] [PubMed] [Google Scholar]
- Hafner M, Landthaler M, Burger L, Khorshid M, Hausser J, Berninger P, Rothballer A, Ascano M Jr, Jungkamp AC, Munschauer M, et al. 2010. Transcriptome-wide identification of RNA-binding protein and microRNA target sites by PAR-CLIP. Cell 141: 129–141. [DOI] [PMC free article] [PubMed] [Google Scholar]
- Hansen HT, Rasmussen SH, Adolph SK, Plass M, Krogh A, Sanford J, Nielsen FC, Christiansen J. 2015. Drosophila Imp iCLIP identifies an RNA assemblage coordinating F-actin formation. Genome Biol 16: 123. [DOI] [PMC free article] [PubMed] [Google Scholar]
- Holmqvist E, Wright PR, Li L, Bischler T, Barquist L, Reinhardt R, Backofen R, Vogel J. 2016. Global RNA recognition patterns of post-transcriptional regulators Hfq and CsrA revealed by UV crosslinking in vivo. EMBO J 35: 991–1011. [DOI] [PMC free article] [PubMed] [Google Scholar]
- Iruarrizaga-Lejarreta M, Varela-Rey M, Lozano JJ, Fernandez-Ramos D, Rodriguez-Ezpeleta N, Embade N, Lu SC, Van Der Kraan PM, Blaney Davidson EN, Gorospe M, et al. 2012. The RNA-binding protein human antigen R controls global changes in gene expression during Schwann cell development. J Neurosci 32: 4944–4958. [DOI] [PMC free article] [PubMed] [Google Scholar]
- Jangi M, Boutz PL, Paul P, Sharp PA. 2014. Rbfox2 controls autoregulation in RNA-binding protein networks. Genes Dev 28: 637–651. [DOI] [PMC free article] [PubMed] [Google Scholar]
- Jungkamp AC, Stoeckius M, Mecenas D, Grun D, Mastrobuoni G, Kempa S, Rajewsky N. 2011. In vivo and transcriptome-wide identification of RNA binding protein target sites. Mol Cell 44: 828–840. [DOI] [PMC free article] [PubMed] [Google Scholar]
- Keene JD, Tenenbaum SA, Carson CC. 2003. Methods for isolating and characterizing endogenous mRNA-protein (mRNP) complexes. U.S. patent application 6635422, filed 1999.
- Keene JD, Komisarow JM, Friedersdorf MB. 2006. RIP-Chip: the isolation and identification of mRNAs, microRNAs and protein components of ribonucleoprotein complexes from cell extracts. Nat Protoc 1: 302–307. [DOI] [PubMed] [Google Scholar]
- Kershner AM, Kimble J. 2010. Genome-wide analysis of mRNA targets for Caenorhabditis elegans FBF, a conserved stem cell regulator. Proc Natl Acad Sci 107: 3936–3941. [DOI] [PMC free article] [PubMed] [Google Scholar]
- Kishore S, Jaskiewicz L, Burger L, Hausser J, Khorshid M, Zavolan M. 2011. A quantitative analysis of CLIP methods for identifying binding sites of RNA-binding proteins. Nat Methods 8: 559–564. [DOI] [PubMed] [Google Scholar]
- Kivioja T, Vaharautio A, Karlsson K, Bonke M, Enge M, Linnarsson S, Taipale J. 2012. Counting absolute numbers of molecules using unique molecular identifiers. Nat Methods 9: 72–74. [DOI] [PubMed] [Google Scholar]
- Konig J, Zarnack K, Rot G, Curk T, Kayikci M, Zupan B, Turner DJ, Luscombe NM, Ule J. 2010. iCLIP reveals the function of hnRNP particles in splicing at individual nucleotide resolution. Nat Struct Mol Biol 17: 909–915. [DOI] [PMC free article] [PubMed] [Google Scholar]
- Kucukural A, Ozadam H, Singh G, Moore MJ, Cenik C. 2013. ASPeak: an abundance sensitive peak detection algorithm for RIP-Seq. Bioinformatics 29: 2485–2486. [DOI] [PMC free article] [PubMed] [Google Scholar]
- Kullmann M, Gopfert U, Siewe B, Hengst L. 2002. ELAV/Hu proteins inhibit p27 translation via an IRES element in the p27 5′UTR. Genes Dev 16: 3087–3099. [DOI] [PMC free article] [PubMed] [Google Scholar]
- Lal A, Mazan-Mamczarz K, Kawai T, Yang X, Martindale JL, Gorospe M. 2004. Concurrent versus individual binding of HuR and AUF1 to common labile target mRNAs. EMBO J 23: 3092–3102. [DOI] [PMC free article] [PubMed] [Google Scholar]
- Lambert N, Robertson A, Jangi M, McGeary S, Sharp PA, Burge CB. 2014. RNA Bind-n-Seq: quantitative assessment of the sequence and structural binding specificity of RNA binding proteins. Mol Cell 54: 887–900. [DOI] [PMC free article] [PubMed] [Google Scholar]
- Lambert NJ, Robertson AD, Burge CB. 2015. RNA Bind-n-Seq: measuring the binding affinity landscape of RNA-binding proteins. Methods Enzymol 558: 465–493. [DOI] [PMC free article] [PubMed] [Google Scholar]
- Lebedeva S, Jens M, Theil K, Schwanhausser B, Selbach M, Landthaler M, Rajewsky N. 2011. Transcriptome-wide analysis of regulatory interactions of the RNA-binding protein HuR. Mol Cell 43: 340–352. [DOI] [PubMed] [Google Scholar]
- Levine TD, Gao F, King PH, Andrews LG, Keene JD. 1993. Hel-N1: an autoimmune RNA-binding protein with specificity for 3' uridylate-rich untranslated regions of growth factor mRNAs. Mol Cell Biol 13: 3494–3504. [DOI] [PMC free article] [PubMed] [Google Scholar]
- Lewis BP, Burge CB, Bartel DP. 2005. Conserved seed pairing, often flanked by adenosines, indicates that thousands of human genes are microRNA targets. Cell 120: 15–20. [DOI] [PubMed] [Google Scholar]
- Li X, Quon G, Lipshitz HD, Morris Q. 2010. Predicting in vivo binding sites of RNA-binding proteins using mRNA secondary structure. RNA, 16: 1096–1107. [DOI] [PMC free article] [PubMed] [Google Scholar]
- Licatalosi DD, Mele A, Fak JJ, Ule J, Kayikci M, Chi SW, Clark TA, Schweitzer AC, Blume JE, Wang X, et al. 2008. HITS-CLIP yields genome-wide insights into brain alternative RNA processing. Nature 456: 464–469. [DOI] [PMC free article] [PubMed] [Google Scholar]
- Livak KJ, Schmittgen TD. 2001. Analysis of relative gene expression data using real-time quantitative PCR and the 2−ΔΔCT method. Methods 25: 402–408. [DOI] [PubMed] [Google Scholar]
- Lu YC, Chang SH, Hafner M, Li X, Tuschl T, Elemento O, Hla T. 2014. ELAVL1 modulates transcriptome-wide miRNA binding in murine macrophages. Cell Rep 9: 2330–2343. [DOI] [PMC free article] [PubMed] [Google Scholar]
- Ma WJ, Cheng S, Campbell C, Wright A, Furneaux H. 1996. Cloning and characterization of HuR, a ubiquitously expressed Elav-like protein. J Biol Chem 271: 8144–8151. [DOI] [PubMed] [Google Scholar]
- Mazan-Mamczarz K, Hagner PR, Dai B, Wood WH, Zhang Y, Becker KG, Liu Z, Gartenhaus RB. 2008. Identification of transformation-related pathways in a breast epithelial cell model using a ribonomics approach. Cancer Res 68: 7730–7735. [DOI] [PMC free article] [PubMed] [Google Scholar]
- Meisner NC, Filipowicz W. 2011. Properties of the regulatory RNA-binding protein HuR and its role in controlling miRNA repression. Adv Exp Med Biol 700: 106–123. [DOI] [PubMed] [Google Scholar]
- Meisner NC, Hackermuller J, Uhl V, Aszodi A, Jaritz M, Auer M. 2004. mRNA openers and closers: modulating AU-rich element-controlled mRNA stability by a molecular switch in mRNA secondary structure. Chembiochem 5: 1432–1447. [DOI] [PubMed] [Google Scholar]
- Mili S, Steitz JA. 2004. Evidence for reassociation of RNA-binding proteins after cell lysis: implications for the interpretation of immunoprecipitation analyses. RNA 10: 1692–1694. [DOI] [PMC free article] [PubMed] [Google Scholar]
- Morris AR, Mukherjee N, Keene JD. 2008. Ribonomic analysis of human Pum1 reveals cis-trans conservation across species despite evolution of diverse mRNA target sets. Mol Cell Biol 28: 4093–4103. [DOI] [PMC free article] [PubMed] [Google Scholar]
- Mukherjee N, Lager PJ, Friedersdorf MB, Thompson MA, Keene JD. 2009. Coordinated posttranscriptional mRNA population dynamics during T-cell activation. Mol Syst Biol 5: 288. [DOI] [PMC free article] [PubMed] [Google Scholar]
- Mukherjee N, Corcoran DL, Nusbaum JD, Reid DW, Georgiev S, Hafner M, Ascano M Jr, Tuschl T, Ohler U, Keene JD. 2011. Integrative regulatory mapping indicates that the RNA-binding protein HuR couples pre-mRNA processing and mRNA stability. Mol Cell 43: 327–339. [DOI] [PMC free article] [PubMed] [Google Scholar]
- Penalva LO, Burdick MD, Lin SM, Sutterluety H, Keene JD. 2004. RNA-binding proteins to assess gene expression states of co-cultivated cells in response to tumor cells. Mol Cancer 3: 24. [DOI] [PMC free article] [PubMed] [Google Scholar]
- Prasad A, Porter DF, Kroll-Conner PL, Mohanty I, Ryan AR, Crittenden SL, Wickens M, Kimble J. 2016. The PUF binding landscape in metazoan germ cells. RNA 22: 1026–1043. [DOI] [PMC free article] [PubMed] [Google Scholar]
- Quinlan AR, Hall IM. 2010. BEDTools: a flexible suite of utilities for comparing genomic features. Bioinformatics 26: 841–842. [DOI] [PMC free article] [PubMed] [Google Scholar]
- Ray D, Kazan H, Chan ET, Pena Castillo L, Chaudhry S, Talukder S, Blencowe BJ, Morris Q, Hughes TR. 2009. Rapid and systematic analysis of the RNA recognition specificities of RNA-binding proteins. Nat Biotechnol 27: 667–670. [DOI] [PubMed] [Google Scholar]
- Reyes-Herrera PH, Speck-Hernandez CA, Sierra CA, Herrera S. 2015. BackCLIP: a tool to identify common background presence in PAR-CLIP datasets. Bioinformatics 31: 3703–3705. [DOI] [PubMed] [Google Scholar]
- Riley KJ, Steitz JA. 2013. The “Observer Effect” in genome-wide surveys of protein-RNA interactions. Mol Cell 49: 601–604. [DOI] [PMC free article] [PubMed] [Google Scholar]
- Sanford JR, Wang X, Mort M, Vanduyn N, Cooper DN, Mooney SD, Edenberg HJ, Liu Y. 2009. Splicing factor SFRS1 recognizes a functionally diverse landscape of RNA transcripts. Genome Res 19: 381–394. [DOI] [PMC free article] [PubMed] [Google Scholar]
- Schueler M, Munschauer M, Gregersen LH, Finzel A, Loewer A, Chen W, Landthaler M, Dieterich C. 2014. Differential protein occupancy profiling of the mRNA transcriptome. Genome Biol 15: R15. [DOI] [PMC free article] [PubMed] [Google Scholar]
- Smith DB, Corcoran LM. 2001. Expression and purification of glutathione-S-transferase fusion proteins. Curr Protoc Mol Biol 28: 16.7.1–16.7.7. [DOI] [PubMed] [Google Scholar]
- Smola MJ, Christy TW, Inoue K, Nicholson CO, Friedersdorf M, Keene JD, Lee DM, Calabrese JM, Weeks KM. 2016. SHAPE reveals transcript-wide interactions, complex structural domains, and protein interactions across the Xist lncRNA in living cells. Proc Natl Acad Sci 113: 10322–10327. [DOI] [PMC free article] [PubMed] [Google Scholar]
- Srikantan S, Tominaga K, Gorospe M. 2012. Functional interplay between RNA-binding protein HuR and microRNAs. Curr Protein Pept Sci 13: 372–379. [DOI] [PMC free article] [PubMed] [Google Scholar]
- Subramanian A, Tamayo P, Mootha VK, Mukherjee S, Ebert BL, Gillette MA, Paulovich A, Pomeroy SL, Golub TR, Lander ES, et al. 2005. Gene set enrichment analysis: a knowledge-based approach for interpreting genome-wide expression profiles. Proc Natl Acad Sci 102: 15545–15550. [DOI] [PMC free article] [PubMed] [Google Scholar]
- Tenenbaum SA, Carson CC, Lager PJ, Keene JD. 2000. Identifying mRNA subsets in messenger ribonucleoprotein complexes by using cDNA arrays. Proc Natl Acad Sci 97: 14085–14090. [DOI] [PMC free article] [PubMed] [Google Scholar]
- Tenenbaum SA, Lager PJ, Carson CC, Keene JD. 2002. Ribonomics: identifying mRNA subsets in mRNP complexes using antibodies to RNA-binding proteins and genomic arrays. Methods 26: 191–198. [DOI] [PubMed] [Google Scholar]
- Ule J, Jensen KB, Ruggiu M, Mele A, Ule A, Darnell RB. 2003. CLIP identifies Nova-regulated RNA networks in the brain. Science 302: 1212–1215. [DOI] [PubMed] [Google Scholar]
- Ule J, Jensen K, Mele A, Darnell RB. 2005. CLIP: a method for identifying protein-RNA interaction sites in living cells. Methods 37: 376–386. [DOI] [PubMed] [Google Scholar]
- Uren PJ, Bahrami-Samani E, Burns SC, Qiao M, Karginov FV, Hodges E, Hannon GJ, Sanford JR, Penalva LO, Smith AD. 2012. Site identification in high-throughput RNA-protein interaction data. Bioinformatics 28: 3013–3020. [DOI] [PMC free article] [PubMed] [Google Scholar]
- Uren PJ, Bahrami-Samani E, De Araujo PR, Vogel C, Qiao M, Burns SC, Smith AD, Penalva LO. 2016. High-throughput analyses of hnRNP H1 dissects its multi-functional aspect. RNA Biol 13: 400–411. [DOI] [PMC free article] [PubMed] [Google Scholar]
- van der Brug MP, Blackinton J, Chandran J, Hao LY, Lal A, Mazan-Mamczarz K, Martindale J, Xie C, Ahmad R, Thomas KJ, et al. 2008. RNA binding activity of the recessive parkinsonism protein DJ-1 supports involvement in multiple cellular pathways. Proc Natl Acad Sci 105: 10244–10249. [DOI] [PMC free article] [PubMed] [Google Scholar]
- Van Nostrand EL, Pratt GA, Shishkin AA, Gelboin-Burkhart C, Fang MY, Sundararaman B, Blue SM, Nguyen TB, Surka C, Elkins K, et al. 2016. Robust transcriptome-wide discovery of RNA-binding protein binding sites with enhanced CLIP (eCLIP). Nat Methods 13: 508–514. [DOI] [PMC free article] [PubMed] [Google Scholar]
- Zarnack K, Konig J, Tajnik M, Martincorena I, Eustermann S, Stevant I, Reyes A, Anders S, Luscombe NM, Ule J. 2013. Direct competition between hnRNP C and U2AF65 protects the transcriptome from the exonization of Alu elements. Cell 152: 453–466. [DOI] [PMC free article] [PubMed] [Google Scholar]
- Zhang C, Darnell RB. 2011. Mapping in vivo protein-RNA interactions at single-nucleotide resolution from HITS-CLIP data. Nat Biotechnol 29: 607–614. [DOI] [PMC free article] [PubMed] [Google Scholar]
- Zhao J, Sun BK, Erwin JA, Song JJ, Lee JT. 2008. Polycomb proteins targeted by a short repeat RNA to the mouse X chromosome. Science 322: 750–756. [DOI] [PMC free article] [PubMed] [Google Scholar]
- Zhao J, Ohsumi TK, Kung JT, Ogawa Y, Grau DJ, Sarma K, Song JJ, Kingston RE, Borowsky M, Lee JT. 2010. Genome-wide identification of polycomb-associated RNAs by RIP-seq. Mol Cell 40: 939–953. [DOI] [PMC free article] [PubMed] [Google Scholar]
Associated Data
This section collects any data citations, data availability statements, or supplementary materials included in this article.