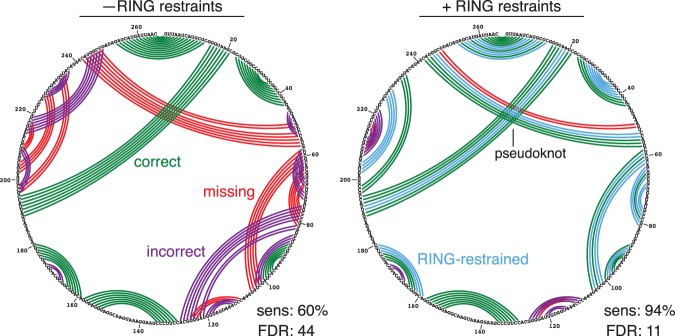
FIGURE 4.
Secondary structure of RNase P catalytic domain predicted using thermodynamic minimum free energy modeling without and with RING-MaP restraints. Green arcs indicate correctly predicted pairs, purple arcs are incorrectly predicted pairs, and red arcs are true pairs missing in the predicted model. Blue arcs indicate enforced RING-MaP base-pairing restraints.

