
Figure 2.
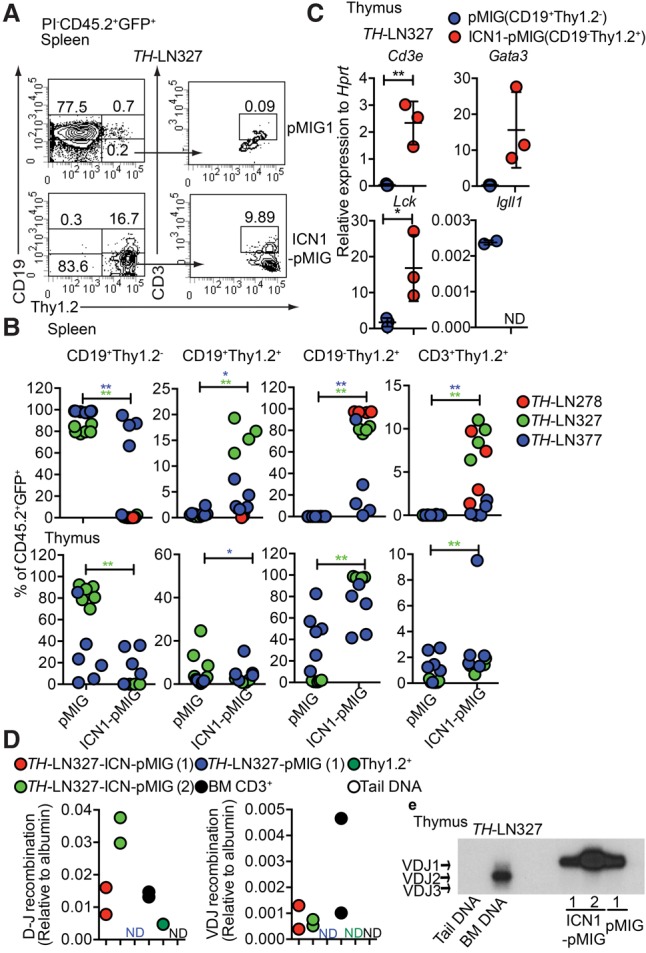
Constitutive activation of the Notch signaling pathway in Pax5+/−Ebf1+/− pro-B leukemia cells causes lineage conversion and expansion of CD19−Thy1.2+ leukemia in vivo. (A) Representative FACS plot of the spleen from a CD45.1 mouse transplanted with ICN1-pMIG or pMIG transduced TH-LN327 (CD45.2) cells. The numbers represent the percentage of total PI−CD45.2+GFP+ events. (B) Percentage of the indicated cell populations (% of PI−CD45.2+GFP+ events) in the spleens and thymi of transplanted mice. Each dot indicates one transplanted mouse, and the color code indicates one independently generated tumor. Statistical analysis was performed using Mann-Whitney U-test. (*) P < 0.05; (**) P < 0.01. Asterisks in the same color as the tumor depicted in the figure indicate significance. (C) qPCR analysis of CD19+Thy1.2+ (pMIG) and CD19−Thy1.2+ (ICN1-pMIG) cells sorted from the thymus of a mouse transplanted with TH-LN327 cells. Statistical analysis was performed using unpaired Student's t-test. (*) P < 0.05; (**) P < 0.01. (D) qPCR data displaying TCRβ DJ and VDJ recombination events in ICN1 or control tumor cells. Primary sorted CD3+ BM cells (BM CD3+), Thy1.2+ in vitro differentiated T-lineage cells (Thy1.2+), and mouse tail DNA were included as positive and negative controls, respectively. The data were normalized to the amplification of a genomic fragment from the albumin gene and present two experiments with duplicate qPCR reactions. (E) Southern blot of PCR products from VDJ recombination events in the IgH locus using genomic DNA from CD19+Thy1.2+ (pMIG) and CD19−Thy1.2+ (ICN1-pMIG) cells sorted from the thymus of a mouse transplanted with TH-LN377. Wild-type mouse tail DNA and BM DNA were used as negative and positive controls, respectively.