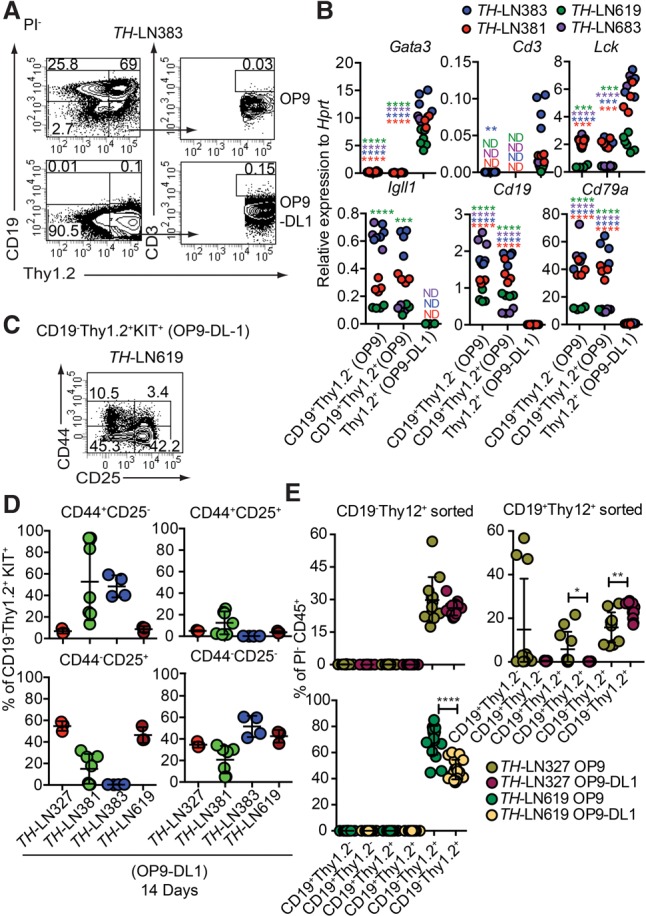
Figure 3.

Extracellular Notch signals are sufficient to cause lineage switch of leukemic pro-B cells to T-lineage cells. (A) Representative FACS plots from TH-LN cultured with OP9 or OP9-DL1 for 14 d. The percentages were calculated from total PI− events. (B) qPCR analysis from TH tumor cells cocultured with OP9 (CD19+ cells) or OP9-DL1 (CD19−Thy1.2+ cells) for 14 d. Each dot indicates a biological replicate analyzed by triplicate qPCR reactions, and the color of the dot indicates one independently generated tumor. Statistical analysis was performed using unpaired Student's t-test. Asterisks in the same color as the tumor depicted in the figure indicates significance. (**) P < 0.01; (***) P < 0.001; (****) P < 0.0001. (C) Representative FACS plot of TH-LN619 cells after 14 d of in vitro differentiation on OP9-DL1 displaying the percentage of cells (% of live events) positive, negative, or double positive for CD44/CD25. (D) Diagrams displaying expression of CD44 and CD25 analyzed by flow cytometry in cells from four TH tumors. (Red) Tumor #327; (green) tumor #381; (blue) tumor #383; (dark red) tumor #619. The percentage of the indicated cell type was calculated from the total number of CD19−Thy1.2+KIT+ events. (E) Diagrams displaying the percentage of the indicated populations out of PI− events after reseeding of either CD19−Thy1.2+ or CD19+Thy1.2+ cells on OP9 or OP9-DL1 cells followed by coculture for 10 d. Each dot indicates one culture, and statistical analysis was performed using Mann-Whitney U-test. (*) P < 0.05; (**) P < 0.01; (****) P < 0.0001.
