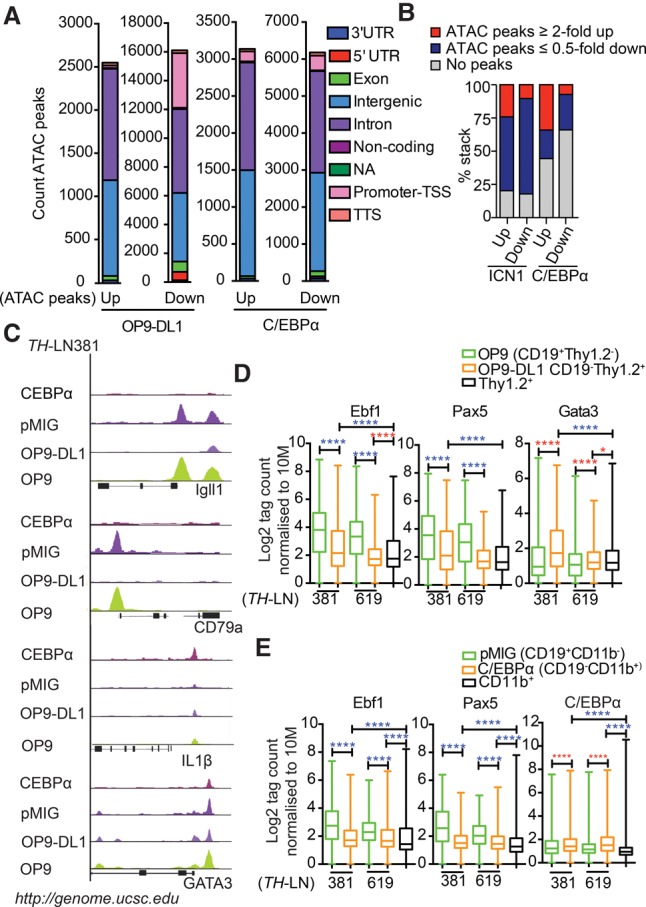
Figure 6.

The conversion of leukemic pro-B cells into T or myeloid lineages involves epigenetic changes associated with the binding of lineage-specific transcription factors. (A) Diagrams displaying the genomic distribution of differential ATAC-seq peaks in in vitro differentiated TH-LN cells. Sorted GFP+CD19+CD11b− and GFP+CD19−CD11b+ from pMIG or C/EBPα-ER-pMIG transduced cells treated with 4-OHT and CD19+Thy1.2+ and CD19−Thy1.2+ populations after coculturing on OP9 or OP9-DL1 stromal cells. (B) Diagrams displaying the link between changes in mRNA levels (as estimated by RNA-seq analysis) and changes in chromatin accessibility (as investigated by ATAC-seq analysis). (C) Peak tracks generated from BedGraph files of ATAC tag coverage in merged duplicate samples created using HOMER and visualized on Igll1, CD79α, IL1β, and Gata3 genes using the University of California at Santa Cruz (UCSC) genome browser (Kent et al. 2002). (D,E) ATAC tags were annotated on peaks from ChIP-seq (chromatin immunoprecipitation [ChIP] combined with high-throughput sequencing) data retrieved from Gene Expression Omnibus (GEO) mapped to mm10 and reanalyzed for peak finding using HOMER (EBF1 [GSE69227], PAX5 [GSE38046], GATA3 [GSE31235], and C/EBPα [GSM537983]). Box plots of log2 tags (means from duplicates) on these peaks were quantified. Statistics was tested using one-way ANOVA with Sidak's multiple comparison test. Significant up-regulation and down-regulation are shown with red and blue asterisks, respectively; (*) P < 0.05; (****) P < 0.0001.
