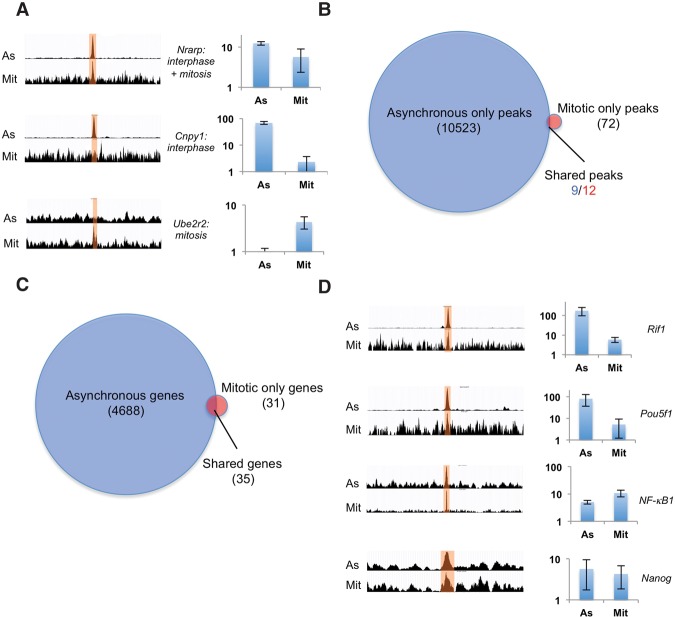
Figure 5.
ChIP-seq analysis of SOX2 in unsynchronized and mitotic cells. (A) Examples of merged triplicate reads of peaks called in only the asynchronous samples, both the asynchronous and mitotic samples, or only the mitotic samples. For each example, asynchronous reads (As) are shown in the top row, and mitotic reads (Mit) are shown in the bottom row. Bar graphs show ChIP-qPCR results as relative fold enrichment over the input. n = 2. Error bars indicate SE. (B) Number of called peaks in asynchronous versus mitotic samples. The different numbers of shared peaks are due to the occasional occurrence of two peaks in the mitotic samples that match a single peak in the asynchronous sample. (C) Number of genes with SOX2 peaks 20 kb upstream of, 20 kb downstream from, or within genes. (D) Merged triplicate reads of peaks in the vicinity of pluripotency regulators that were not called but were identified as enriched by ChIP-qPCR. Bar graphs show ChIP-qPCR results represented as relative fold enrichment over the input. n = 2. Error bars indicate SE.

