Figure 2.
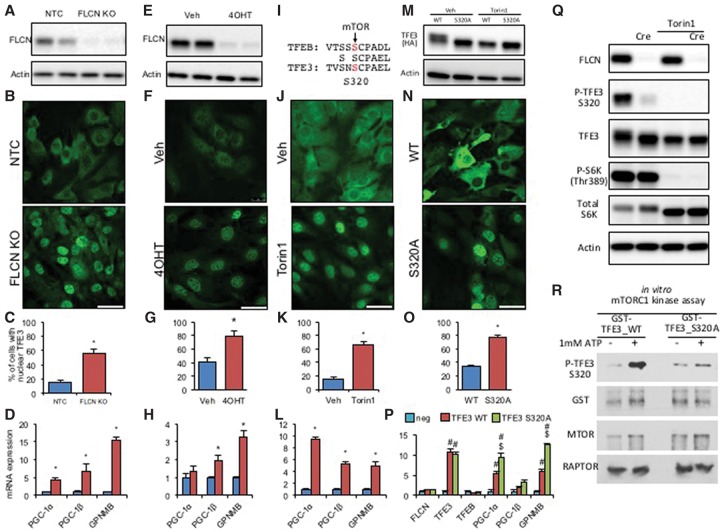
FLCN deletion and mTOR inhibition promote TFE3 nuclear localization to induce TFE3 target genes in preadipocytes. (A) Western blot of FLCN in nontarget control (control) or FLCN guide RNA (gRNA) plus CRISPR/Cas9-expressing stromal vascular fraction (SVF) cells. (B) Immunofluorescence staining of TFE3 in control or FLCN-deleted SVF cells. (C) Quantification results of TFE3 nuclear localization shown in B. (D) Relative mRNA expression of TFE3 target genes in the control or FLCN-deleted SVF cell line. (E) Western blot of FLCN in vehicle (veh) or 4OHT-treated (10 μM for 48 h) CreERt2-expressing SVF cells isolated from FLCNlox/lox iWAT. (F–H) As in B–D but with FLCNlox/lox CreERt2 cells treated with vehicle versus 4OHT. (I) Schematic of the mTOR phosphorylation site in TFEB and its conservation in TFE3. (J–L) As in B–D but with cells treated with vehicle versus 250 nM mTOR inhibitor Torin1 for 1 h (J,K) or 4 h (L). (M) Western blot of stably expressed HA-tagged wild-type TFE3 or mTOR site-mutated TFE3 (S320A). Cells were treated with vehicle (veh) or Torin1 for 2 h. (N–P) As in B–D but with cells expressing TFE3 wild type or TFE3 S320A. (Q) Western blot of FLCN, phospho-TFE3 (Ser320), TFE3, phospho-S6K (Thr 389), and total S6K in FLCNlox/lox cells infected with adenovirus harboring Cre versus GFP (mock) and 250 nM Torin1 for 2 h versus vehicle. (R) In vitro mTORC1 kinase assay of TFE3: GST-fused TFE3 wild-type and S320A mutant were incubated with purified mTORC1, and phosphorylated Ser320 was detected by anti-pTFE3 (S320) antibody. (*) P < 0.05 by Student's t-test; (#) P < 0.05 versus mock; ($) P < 0.05 versus TFE3 wild type. n = 3 or 4 per group. Values are represented as mean ± SEM. Bars, 50 µm.

