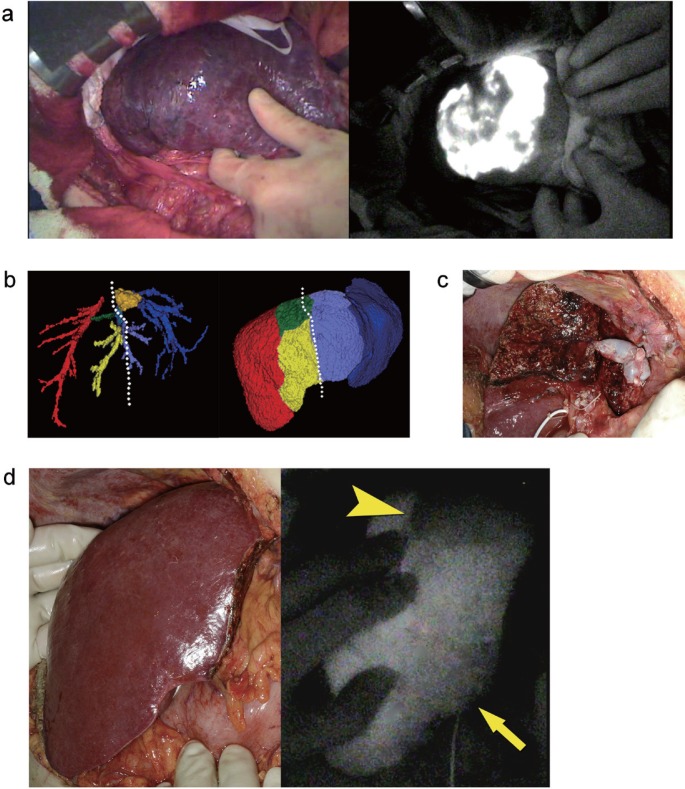
Fig. 2.
Fluorescence imaging. a Gross appearance of the liver surface after dye injection (left) and corresponding fluorescence image (right). b Tumor location and planned resection line (white dotted line) were demonstrated on preoperative 3DCT. The remnant liver volume was estimated to be 429 ml, consisting of non-veno-occlusive regions drained by the right hepatic vein (246 ml) and of veno-occlusive regions resulting from the division of the MHV tributaries draining segment 5 (V5) (163 ml) and segment 8 (V8) (30 ml). c Intraoperative gross appearance following extended left hepatectomy with excision and reconstruction of the MHV tributaries. d Fluorescence imaging following intravenous injection of ICG reveals the demarcation between the region drained by the reconstructed vein (arrow) and that with venous occlusion (arrowhead) (From left to right, gross appearance and fluorescence image 240 seconds after the injection).

