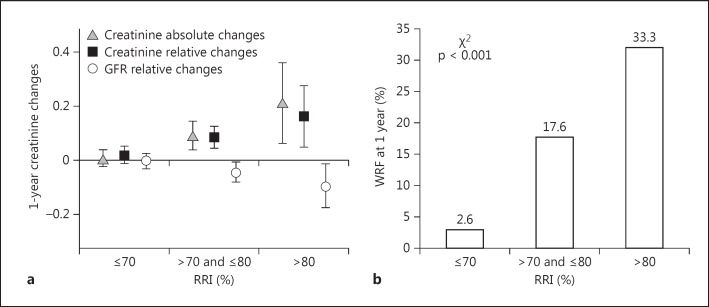
Fig. 1.
a One-year absolute (triangles) and relative (black squares) changes of creatinine and relative changes of the GFR (open circles) in the groups of patients according to the RRI values. At ANOVA analyses, p < 0.05 was observed for all variables. b The development of a WRF at 1 year (i.e. an increase in serum creatinine by ≥0.3 mg/dl from enrolment) in the same patient subgroups is shown. p refers to the χ2 test. Data are presented as the mean ± 95% CI.

