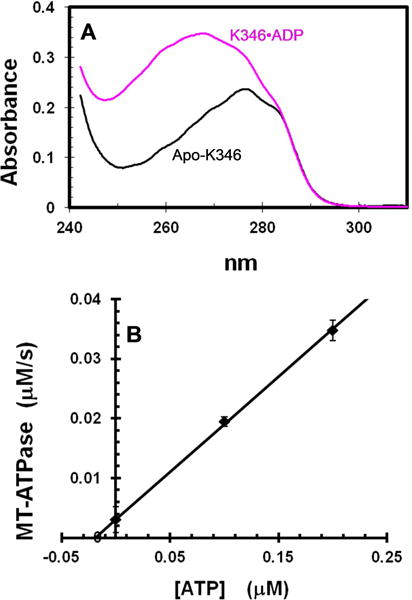
Figure 1. Evaluation of residual ADP in apo-K346.

A. Spectra of K346•ADP and apo-K346 at 15 μM in 6 M guanidine hydrochloride. K346•ADP at >600 μM was dialyzed against buffer with 100 μM free ADP to ensure saturation with ADP and to allow correction for the contribution of free ADP by subtracting the spectrum of an equivalent dilution of the solution outside the dialysis bag. B. MT-ATPase of apo-K346. The reaction was initiated by addition of 0.87 μM apo-K346 to 1.5 μM MTs in an ATPase reaction mixture with 2 mM PEP, 0.2 mM NADH, pyruvate kinase and lactic dehydrogenase, but without ATP. A low ionic strength buffer was used to increase the affinity of kinesin for MTs (20 mM Mops pH7.0, 2 mM MgCl2 and 0.1 mM EDTA). Addition of ATP to 0.1 and 0.2 μM produced a linear increase in rate. Based on this slope, the rate in the absence of added ATP corresponds to that expected for 0.019 μM ATP or 2% of the 0.87 μM K346 sites. This represents an upper limit because the MTs likely contain some free GDP/GTP that would be a substrate for both pyruvate kinase and K346. Note that apo-K346 is not inactivated over time in this assay because it is stabilized by binding to the MTs.
