
Fig. 10. Diagram for free energy versus reaction coordinate for EA, TS and ER in 0 and 20% glycerol.
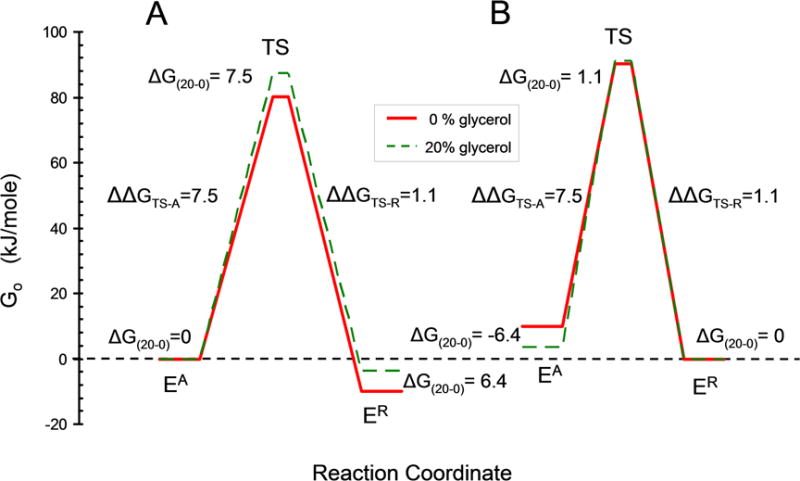
A. Preferential destabilization of ER by glycerol. The free energies for EA in 20% and 0% glycerol (dashed and solid lines respectively) were first fixed at the same zero value with ΔG(20–0) = 0 for the difference in free energy between EA in 20 and 0 % glycerol. Preferential destabilization of ER by glycerol was then modeled by lowering the free energy of ER by the amount required by the KR values in Table I using ΔGAR(0%) = −RT ln(KR(0%)) = −10.0 kJ/mole and ΔGAR(20%) = −RT ln(KR(20%)) = −3.6 kJ/mole. The free energy of the transition states were calculated from the velocity values in Table I using velocity = (kBT/h)e−ΔG╪/RT where kB is the Boltzmann constant and h is the Planck constant. B. Preferential stabilization of EA by glycerol. Calculated similarly to (A) but starting with the free energy of ER in 0 and 20 % glycerol fixed at zero and glycerol preferentially stabilizing EA.