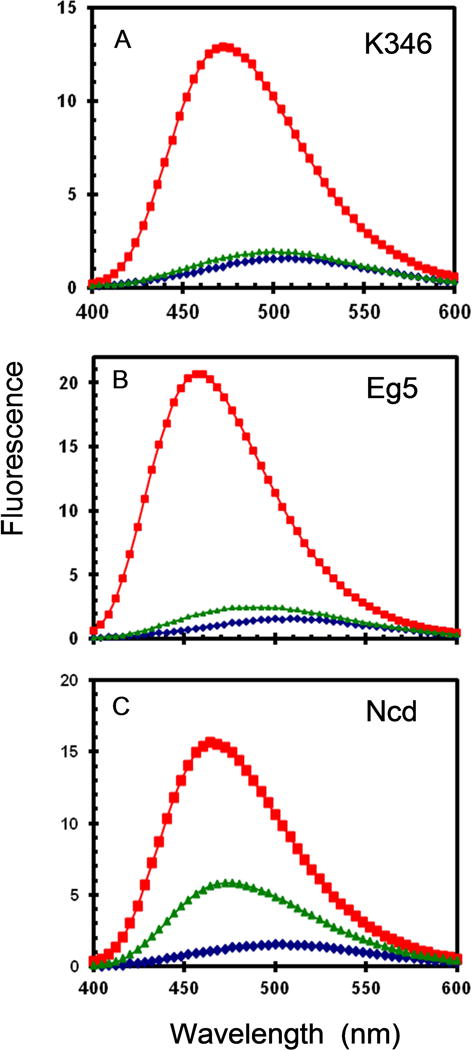
Fig. 9. ANS fluorescence.

Fluorescence emission spectra for 20 μM ANS and 2 μM apoprotein in buffer without glycerol. (A) K346; (B) Eg5; (C) Ncd. ANS alone (diamonds); ANS with protein and 1 mM ADP (trianges); ANS with protein in absence of ADP (squares) are bottom to top lines respectively.
