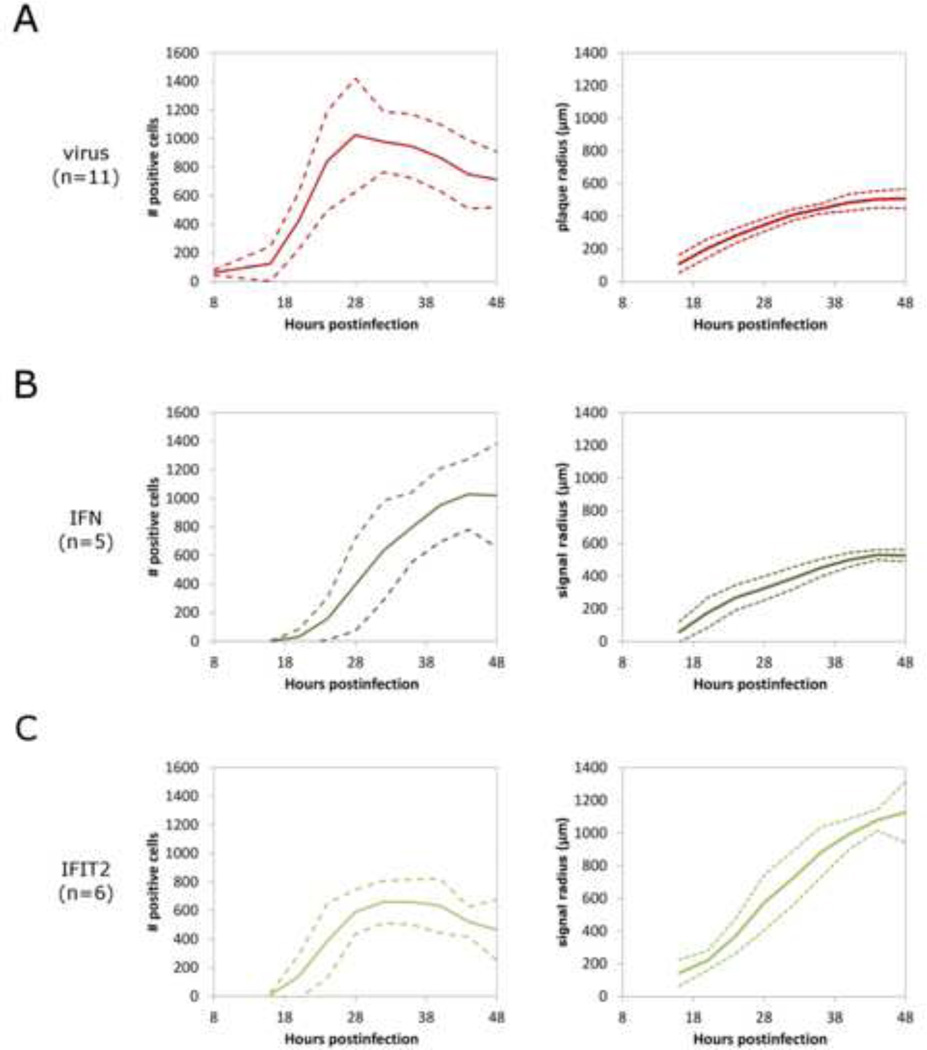
Figure 2. Quantification of virus and immune response spread in plaque-spread infections of A549 cells.
Time-lapse images of plaque-spread infections were analyzed for # of cells that show positive signal and spread radius of reporter signal for A) VSV-M51R-DsRedExpress virus replication, B) cellular IFNβ induction, and C) interferon-stimulated antiviral effector protein IFIT2 induction. Quantification of plaque spread in terms of # of positive reporter cells is given per plaque, +/− standard deviations over the given number of plaques. Quantification of plaque spread radius is calculated by area of positive signal spread from the origin of infection per plaque, +/− standard deviations over the given number of plaques.

