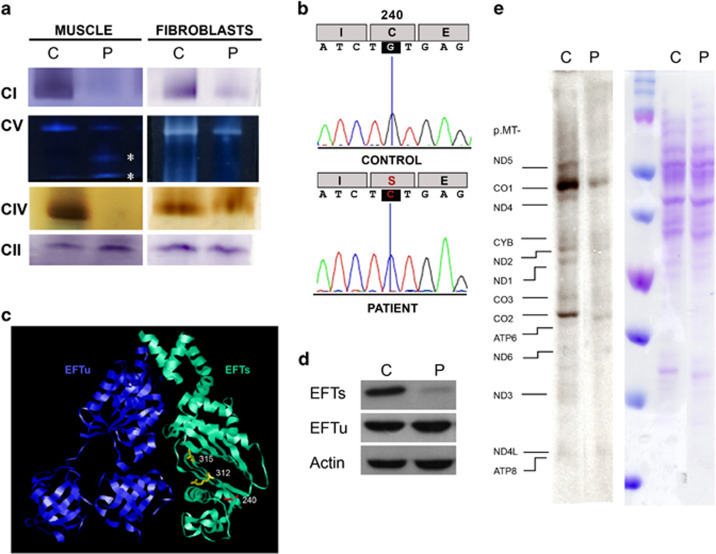
Figure 1.
OXPHOS characteristics. (a) OXPHOS complex (CI, CII, CIV and CV) in-gel activities from muscle and fibroblasts of patient (P) and control (C). Asterisks indicate CV sub-complexes. (b) TSFM cDNA sequence obtained by Sanger method. (c) Structural modeling of EFTu–EFTs dimer. The locations of EFTs amino acids that have been previously associated with missense pathologic mutations are showed in yellow color, and the new one, here reported, is shown in red color. (d) EFTs and EFTu immunoblots. (e) Mitochondrial translation products. Gels show loading controls (right) and electrophoretic patterns of mitochondrial translation products (left) from patient (P) and control (C) fibroblasts. Gels of this figure have been cropped to improve the clarity and conciseness of the presentation. See Supplementary Figure S3 for uncropped gel images.

