Figure 2.
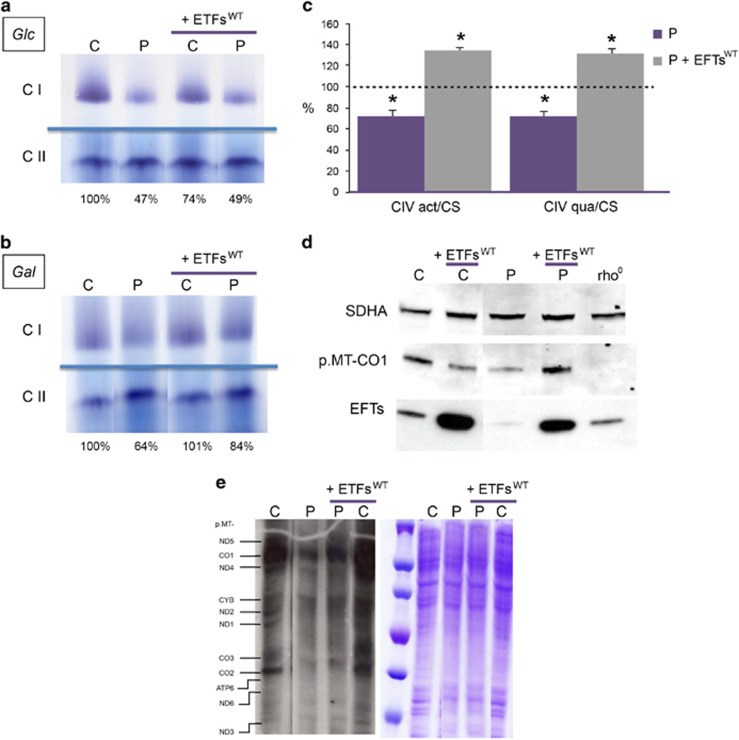
Wild-type EFTs overexpression (+EFTswt) in patient fibroblasts recovers OXPHOS parameters. CI and CII in-gel activities from control (C) and patient (P) fibroblasts grew in high-glucose (25 mm) (a) and galactose (5 mm) medium (b). The control CI/CII ratios are considered 100%. (c) CIV activity/citrate synthase activity (CIV act/CS) and CIV quantity/CS activity (CIV qua/CS) ratios. Dot line represents mean values of untransfected and transfected control fibroblasts. Bars indicate the mean values (and SDs, n=3) of untransfected (P) and transfected (P+EFTsWT) mutant fibroblasts. Asterisks denote statistically significant P-values (mutant vs control) (unpaired t-test) (d) p.MT-CO1 immunoblot. An immunoblot for the nDNA-encoded CII subunit, SDHA, is also shown as a loading control. EFTs immunoblots confirm the overexpression of this translation factor in the transfected cells. Rho0 indicates cells with no mtDNA and, therefore, without the mtDNA-encoded p.MT-CO1. (e) Mitochondrial translation products. Gels show loading controls (right) and electrophoretic patterns of mitochondrial translation products (left) from patient (P) and control (C) fibroblasts. Gels of this figure have been cropped to improve the clarity and conciseness of the presentation. See Supplementary Figure S3 for uncropped gel images.

