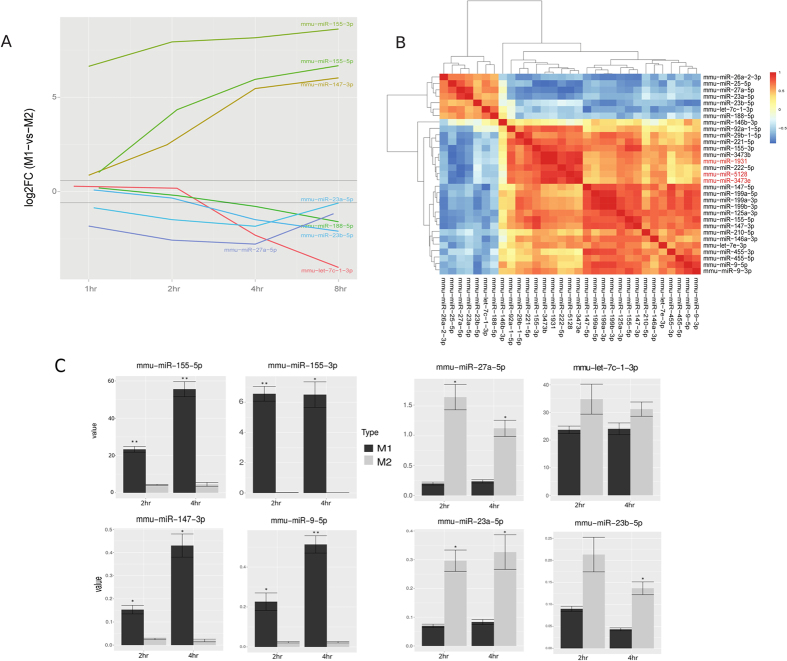
Figure 2. Differentially expressed (DE) miRNAs in mouse M1 vs. M2 macrophages.
(A) log2 averaged fold-change of differentially expressed miRNAs at 4 time points, with highlights on a few miRNAs with the most drastic changes over time. (B) Hierarchical clustering among DE miRNAs based on Spearman’s correlation coefficient (SCC). The three less-studied miRNAs are highlighted by red. (C) qPCR validation of top 4 differentially expressed miRNAs for M1 and M2 conditions respectively, at 2 and 4 hours. (n = 3, *p < 0.05, **p < 0.001).

