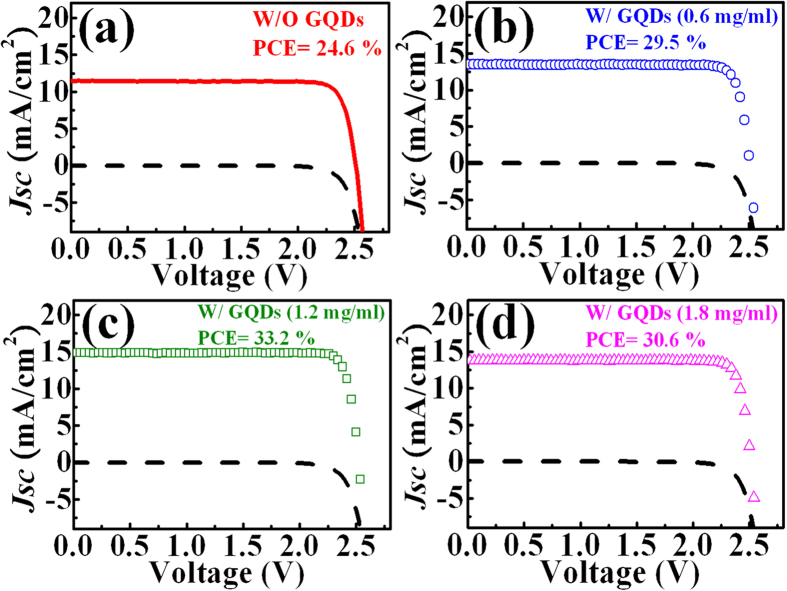
Figure 3. The photovoltaic J–V characteristics of triple-junction solar cells with various concentration of GQDs.
(a) 0 (solid line), (b) 0.6 (open circles), (c) 1.2 (open squares), and (d) 1.8 mg/ml (open triangles). The dashed lines represent the J-V characteristics of the cell under dark condition. The power conversion efficiency (PCE) of the cells with various concentration of GQDs are also shown.

