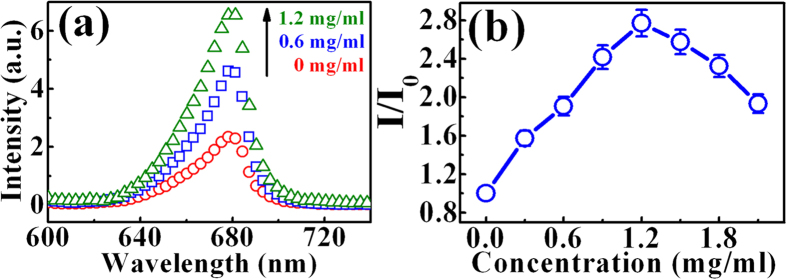
Figure 5.
(a) PL spectra of the InGaP after incorporation of GQDs with different concentration: 0 (open circles), 0.6 mg/ml (open squares), and 1.2 mg/ml (open triangles). (b) The PL intensity ratio of the InGaP with GQDs to that without GQDs as a function of the GQD concentration. The line is a guide to eyes.

