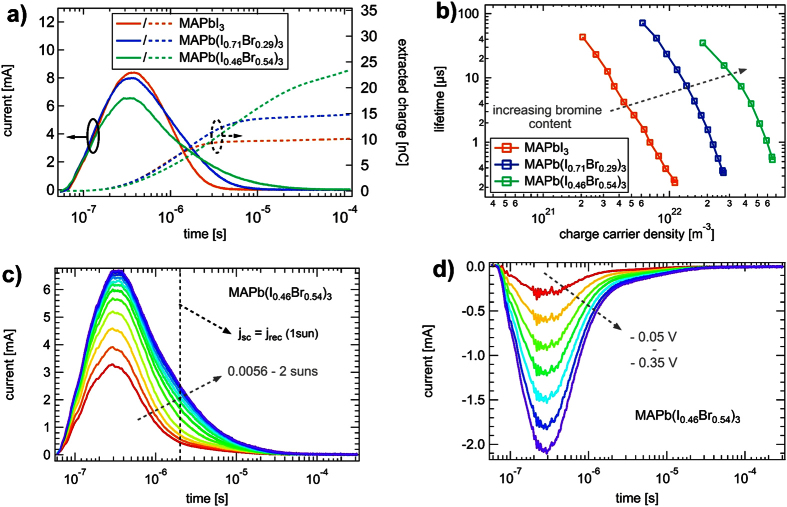
Figure 3.
(a) CE signal (left axis) and the integral (right axis) for the three investigated devices after illuminated with 1 sun. (b) TPV lifetime plotted versus the charge carrier density determined with CE. (c) CE signal of MAPb(I0.46Br0.54)3 for different illumination intensities. (d) CE signal in the dark realized by applying negative voltages before switching to short circuit conditions.

