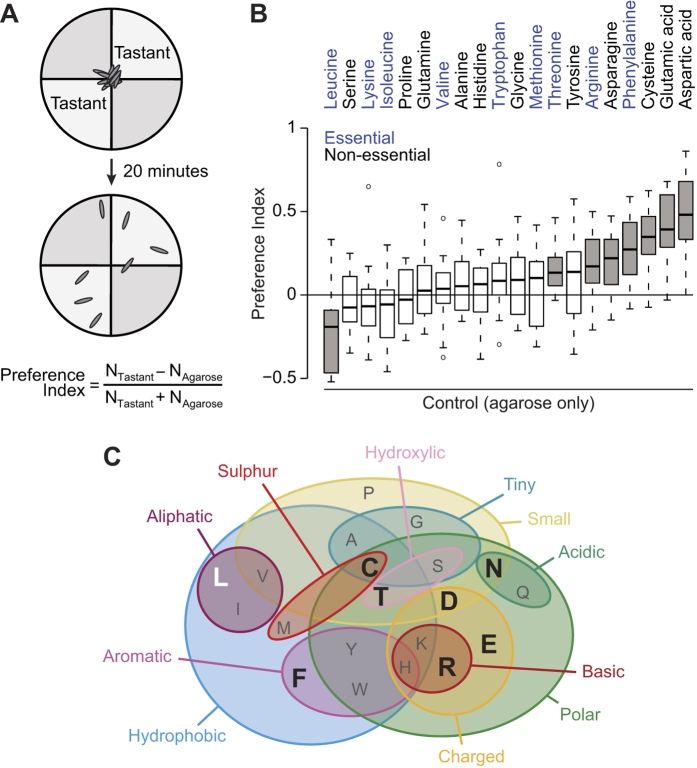
Figure 1. Drosophila larvae display innate, stimulus-specific responses to amino acids.
(A) Schematic of the larval gustatory choice assay. Groups of ~30 experimentally-naïve larvae are placed at the centre of a Petri dish divided in four quadrants, which contain control (agarose alone) or test (agarose + tastant) substrates. The Preference Index is calculated by counting the number of larvae on each substrate and dividing the difference by the total number of larvae; positive values reflect behavioural attraction towards a tastant-containing substrate. (B) Preference Indices of wild-type larvae (w1118) for substrates containing individual L-amino acids (all at 50 mM, except for tyrosine, which was used at 2 mM because of its lower solubility). Essential amino acids are shown in blue. Grey boxes indicate amino acids that produce a Preference Index significantly different from 0 (t-test with Bonferroni correction, p < 0.0025). For boxplots in this and subsequent figures, the boxes represent the upper and lower quartiles, the thick line is the median value and the whiskers show the 5th and 95th percentiles. Circles outside the whiskers are outliers. (N ≥ 18 groups of ~30 larvae for each tastant). (C) Venn diagram (adapted from ref. 57) summarising the main physico-chemical properties of amino acids, indicated by single letter codes. Large black letters indicate those that are attractive to larvae; the sole aversive amino acid is shown in white.

