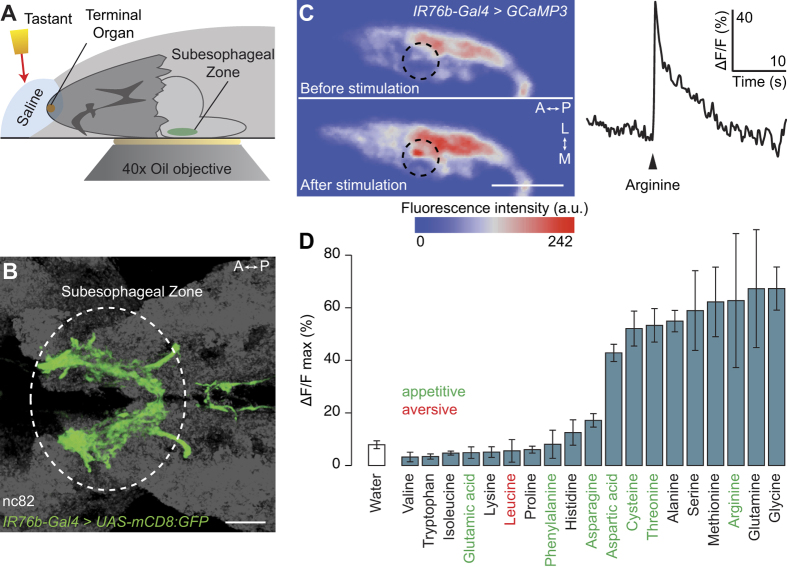
Figure 3. IR76b-Gal4 neurons respond physiologically to amino acids.
(A) Schematic of the calcium imaging assay. A larval head is dissected, leaving the brain attached, and embedded in agarose. Calcium responses in the subesophageal zone (SEZ) are measured while a tastant solution is applied to the peripheral chemosensory organs. (B) Projections of IR76b-Gal4 neurons to the SEZ (IR76b-Gal4;UAS-mCD8:GFP). The neuropil marker nc82 is shown in grey. Scale bar: 20 μm; A: anterior, P: posterior. (C) Left: False-coloured representation of GCaMP3 fluorescence intensity in one hemisphere of the SEZ of a UAS-GCaMP3;IR76b-Gal4 animal, before and after presentation of 50 mM arginine. Scale bar: 20 μm; L: lateral, M: medial. Right: example time course of the calcium response of IR76b-Gal4 neurons to arginine presentation (arrowhead) from the region of interest indicated by a dashed circle on the left panel. (D) Peak ΔF/F value observed in IR76b-Gal4 neurons after stimulation with 19 individual amino acids (concentration: 50 mM) or water solvent. (Mean response ± SEM is shown; N ≥ 4 animals per stimulus). The valence of the behavioural responses towards amino acids (from Fig. 1B) is indicated by the colour of lettering.

