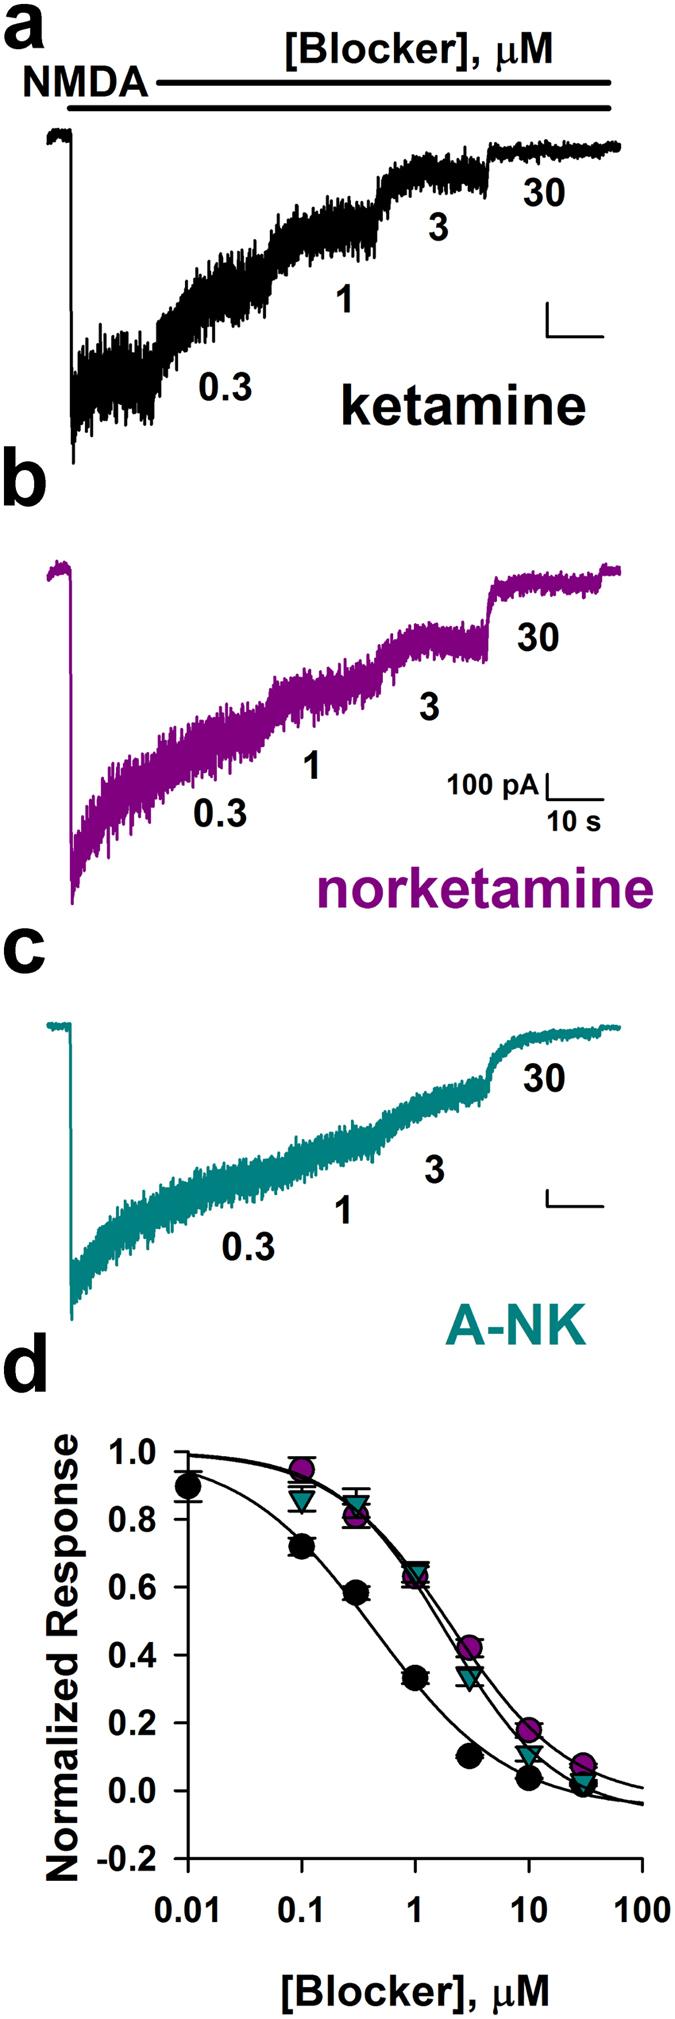
Figure 4. Norketamine and A-NK are less potent than ketamine.

(a–c) Representative traces depict inhibition by increasing concentrations (0.3, 1, 3, 30 μM) of ketamine (a), norketamine (b) and A-NK (c). Concentrations are given below each trace. (d) Steady-state block achieved in pooled results from cells challenged with the indicated concentrations. Concentration-response curves for ketamine, norketamine, and A-NK are shown (n = 9–10). Solid lines represent fits to the Hill equation of the form I = Imax* Cn/(IC50n + Cn), where Imax is maximum current in the absence of agonist, C is antagonist concentration, n is the Hill coefficient, and IC5αs the concentration inhibiting 50% of the response. The respective IC50 values and Hill coefficients for the compounds were estimated from fits to be: 0.4 μM and 0.7 (ketamine), 2.0 μM and 0.8 (norketamine) and 1.8 μM and 0.9 (A-NK). Ketamine was significantly more potent than norketamine and A-NK (p < 0.05, unpaired t-tests, from EC50 values obtained from fits to individual cells).
