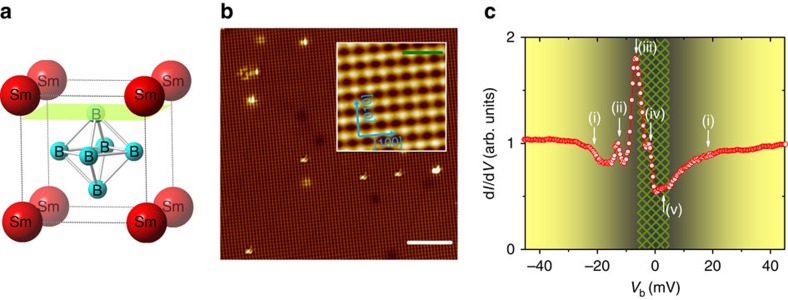
Figure 2. B-terminated surface and STS spectra at base temperature.
(a) Cubic crystal structure of SmB6 with lattice constant a=4.133 Å. The green plane indicates a cleave with B-terminated surface. (b) STM topography on a 30 × 30 nm2 non-reconstructed B-terminated surface of SmB6 (T=0.35 K, bias voltage Vb=300 mV, set-point current Isp=400 pA, scale bar, 5 nm). Note the small number of defects. The total height scale is 200 pm. The zoomed inset (scale bar, 1 nm) shows the orientation of the crystallographic axes, clearly indicating B termination. (c) Spatially (2 × 2 nm2) averaged STS on part of the surface displayed in the inset of b. Several features can clearly be distinguished within ±20 mV, which are marked as (i) to (v) and discussed in the text. Yellow to grey background in c indicates the energy range within which the gap opens, while the patterned area marks the region for potential in-gap states. Vb=50 mV, Isp=125 pA, modulation voltage Vmod=0.2 mV.

