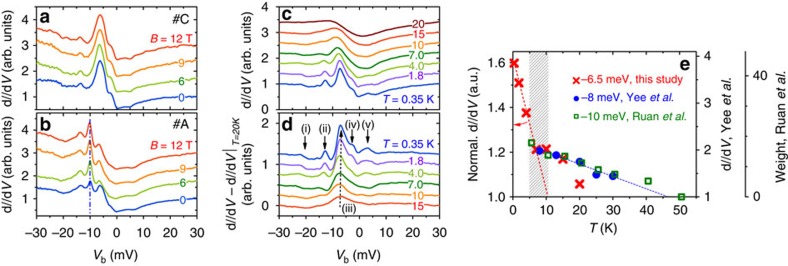
Figure 4. Magnetic-field and temperature dependence of STS spectra.
Tunnelling spectra measured at magnetic fields up to 12 T and 0.35 K on the top of (a) site #C away from any impurity and (b) site #A atop a small impurity. (c) Evolution of dI/dV-curves from 0.35 K to 20 K. To compare the data, a small linear background is subtracted from the raw data. (d) Difference tunnelling conductance after subtracting the g(V)-data measured at 20 K. (e) Temperature dependence of the intensity of peak (iii). Results for intensities by Yee et al.36 (blue) and spectral weights by Ruan et al.38 (green) are shown for comparison (right axes). Curves are offset for clarity in (a–d). Vb=30 mV, Isp=100 pA, Vmod=0.3 mV.

