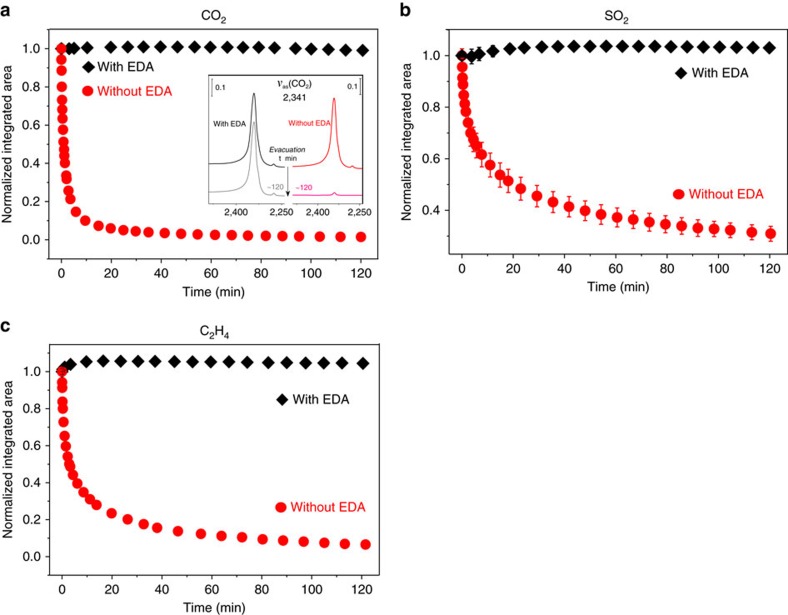
Figure 3. Time evolution of the vibrational bands νas(CO2) νas(SO2) and δ(CH2) upon evacuation.
(a) Normalized integrated area of CO2 asymmetric stretching mode νas upon evacuation (<20 mTorr) in pristine (red circles) and EDA post-loaded (black diamonds). The spectral evolution of νas(CO2) bands is shown in Supplementary Fig. 11. The error bar of normalized integrated area does not exceed ∼0.025 for the intensity determination of the νas(CO2) band. The inset of a shows the spectra of νas(CO2) band at t=0 and ∼120 min. (b) Normalized integrated areas of SO2 asymmetric stretching mode νas upon evacuation (<20 mTorr) in pristine (red circles) and EDA post-loaded (black diamonds), The spectral evolution of the νas(SO2) is shown in Supplementary Fig. 12. The larger error bar in b for the νas(SO2) band was due to interferences of the MOF phonon bands, leading to uncertainties in determining the baseline in the difference spectra (Supplementary Fig. 12c). (c) Normalized integrated areas of C2H4 wagering mode δ upon evacuation (<20 mTorr) in pristine (red circles) and EDA post-loaded (black diamonds). The spectral evolution of δ(CH2) bands is shown in Supplementary Fig. 13. The error bar of normalized integrated area does not exceed ∼0.025 for the intensity determination of the δ(CH2) bands. For the pristine sample, the initial point (that is, t=0) is chosen as the peak intensity after evacuation of gas phase (CO2, SO2, C2H4) for ∼10 s; for MOFs post-loaded with EDA, the starting point is still after gas removal at the end of EDA exposure (that is, t=0); the integrated areas are normalized to the maximum value obtained at t=0.

