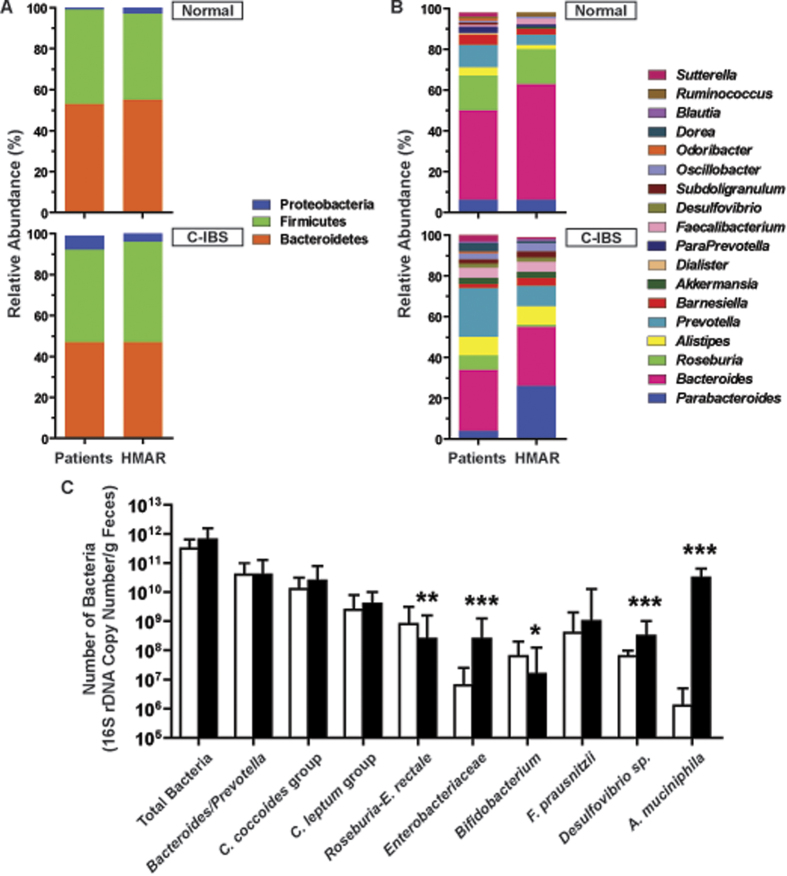
Figure 1. Comparison of bacterial composition and diversity in fecal samples from human and HMAR.
Relative 16S rDNA gene abundances of the major phyla (A) and genera (B) detected in human and HMAR fecal samples. These figures represent the data obtained with the fecal microbiota of one healthy individual and one C-IBS patient, and of the corresponding H-MAR and C-IBS HMAR; similar data have been obtained with the two others healthy individuals and C-IBS patients. In (A), there was no significant differences between the composition of the microbiota of the human subjects and HMAR: Healthy microbiota, p = 0.54; C-IBS microbiota, p = 0.35. (C) Quantification of the major gut bacterial populations or species in healthy (open bars) or C-IBS microbiota (plain bars). The figure depicts the quantitative PCR data obtained with the fecal samples of HMAR derived from one healthy individual and one C-IBS patient; n = 5 rats for healthy microbiota and n = 5 rats for C-IBS microbiota. *P < 0.05, **P < 0.01, ***P < 0.001, denote significant difference vs. N-HMAR.

