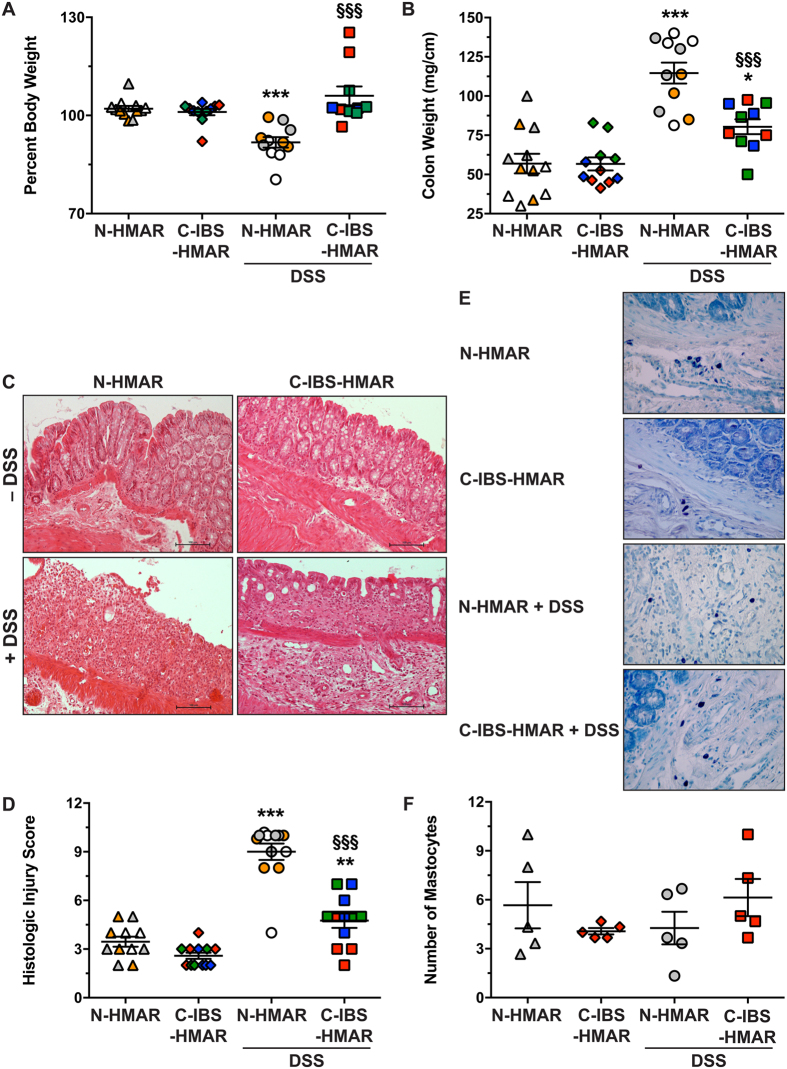
Figure 2. Effect of healthy and C-IBS microbiota on colonic inflammation.
N-HMAR and C-IBS-HMAR were given water or 4% DSS in their drinking water for 7 days. (A) Body weights of the rats were measured before DSS treatment and at the end of the experiment, and are presented as percentage of initial body weight. (B) Colon weights and lengths were measured and the ratio is presented for each animal. (C and D) Colons were fixed and stained with hematoxylin-eosin-saffron; representative photomicrographs of N-HMA and C-IBS-HMA rat colons treated or not with DSS are shown (C); these tissues were scored for total histological injury (D). For A, B, and D, **P < 0.01, ***P < 0.001 vs. N-HMA or C-IBS-HMA without DSS; §§§P < 0.001 vs. N-HMAR treated with DSS. The data depict experiments performed with the gut microbiota of three different control or C-IBS patients inoculated to 3–5 rats; each symbol represents one animal and each color depicts the microbiota of one individual. (E and F) Representative staining of colons for mastocytes (dark violet; E); the mean of the number of mastocytes observed in three fields (X400) for each tissue is presented in F. The data obtained with the microbiota of one healthy individual and one C-IBS subject is shown.

