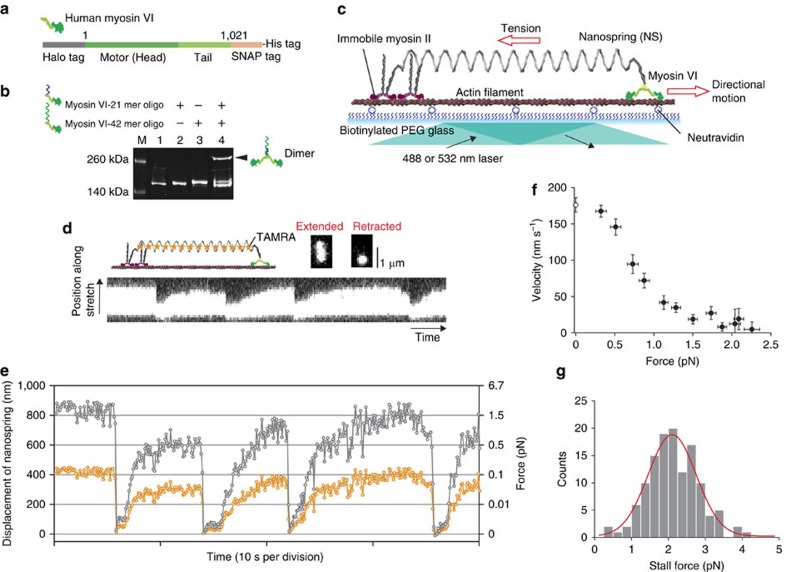
Figure 2. Nanospring–motor protein complex to measure single-molecule dynamics under load.
(a) Monomeric myosin VI constructs. (b) A gel-shift assay confirmed the labelling of oligos and DNA-induced dimerization. M, marker; lane 1, myosin VI monomer; lane 2, myosin VI monomer labelled with 21 mer oligo (myosin VI-21 mer oligo); lane 3, myosin VI monomer labelled with 42 mer oligo (myosin VI-42 mer oligo); lane 4, myosin VI-21 mer oligo mixed with myosin VI-42 mer oligo. The black arrowhead indicates a dimer fraction. (c) Myosin VI tethered to a two-helix bundle (2HB) nanospring moves unidirectionally along actin against the load of the nanospring. (d) Visualization of the stretch/compression dynamics of the nanospring by myosin VI at 2 mM ATP+100 μM ADP. The kymograph shows repetitive stretching and compressing of the TAMRA-labelled nanospring. (e) Trajectory of the centre position of the fluorescence image of the nanospring (orange circles). The displacement was multiplied by 2, to measure the spring extension from which the force was calculated (grey circles). (f) Averaged force–velocity curve at 2 mM ATP+100 μM ADP. Error bars represent s.e.m. Velocities at 0 pN force were measured by tracking myosin VI-NS in the absence of immobile myosin II (open circle, N=28). (g) A stall force histogram. Stall over 2 s were included in the analysis. The red line marks a a Gaussian function fit (2.1±0.6 pN (mean±s.d.)).

