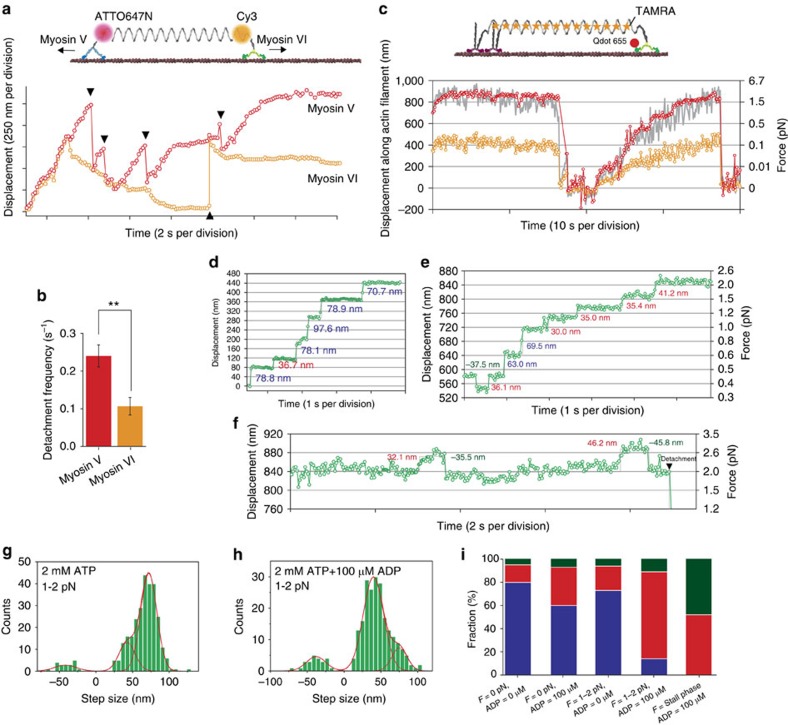
Figure 3. Dual colour imaging of single-molecule tug-of-war and nanoimaging of myosin VI head domain under load.
(a) Typical trajectory for dual colour imaging of tug-of-war between myosin V and VI at 2 mM ATP+100 μM ADP. Red circles, the ATTO647N position, which indicates myosin V motion; orange circles, the Cy3 position, which indicates myosin VI motion. Black triangles indicate detachment events. (b) Detachment frequency during tug-of-war for myosin V (red) and myosin VI (orange). Error bars indicate s.e.m. N=47 myosin-NS complexes, **P<0.01 (two-sided t-test). (c) Trajectories of a QD (red circles) attached to the head of a myosin VI, the centre position of a TAMRA nanospring (orange circles) and two times the displacement of the centre position of the TAMRA nanospring (grey line) at 2 mM ATP+100 μM ADP. Recording rate, 10 Hz. (d–f) Trajectories at 2 mM ATP and 0 pN (d), 2 mM ATP+100 μM ADP and 0.4-2 pN (e), and stall force (f). Recording rate, 30 Hz. The red Gaussian fits in g represent step sizes at 2 mM ATP and 1–2 pN load (−41.8±15, 42.5±11 and 72.1±11 nm) and in h at 2 mM ATP+100 μM ADP and 1–2 pN load (−38.0±13, 40.0±13 and 75.3±10 nm). Error indicates s.d. (i) The distribution of large (blue), short (red) and backward (dark green) steps at different loads and ADP concentrations estimated from the Gaussian fits.

