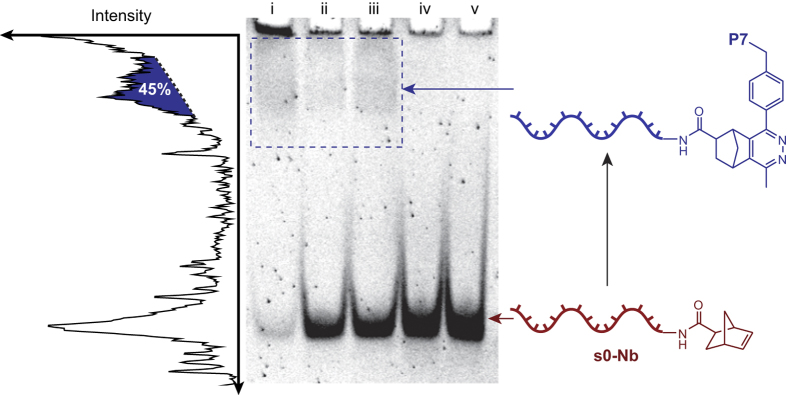
Figure 3. 15% native PAGE analysis of the conjugation of P7 to s0-Nb.
The DNA-polymer conjugate was visible as a slow-migrating band (blue box) when water, DMF or DMAc were used as the reaction solvent (lanes i-iii), but not with NMP (lane iv) or DMSO (lane v). Left: Densitometry plot of lane i showing the band assigned to the DNA-polymer conjugate - the yield was calculated by comparing the areas under the conjugate and free s0-Nb peaks.

