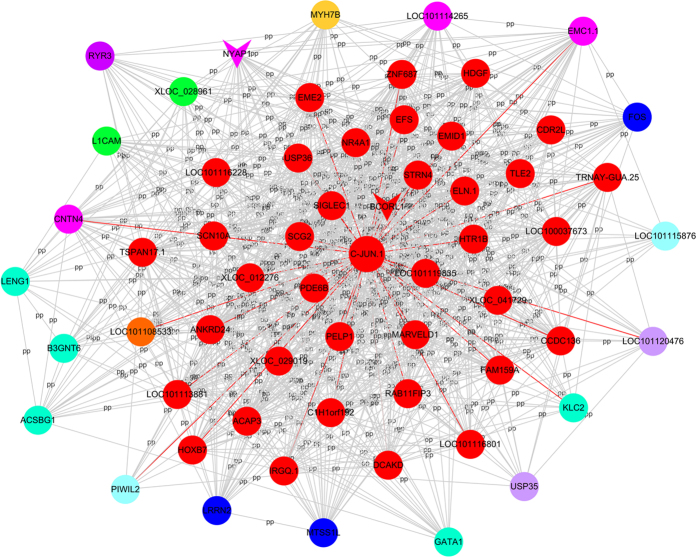
Figure 5. Coexpression network of the differentially expressed genes and lncRNAs in the brown module.
Node colour denotes differential expression levels. Blue represents down-regulation, and red represents up-regulation. Other node colours represent non-differential expression. Node size represents the importance of a node. The edge denotes the interaction strength. Circle nodes represent genes, and inverted triangles denote lncRNAs.

