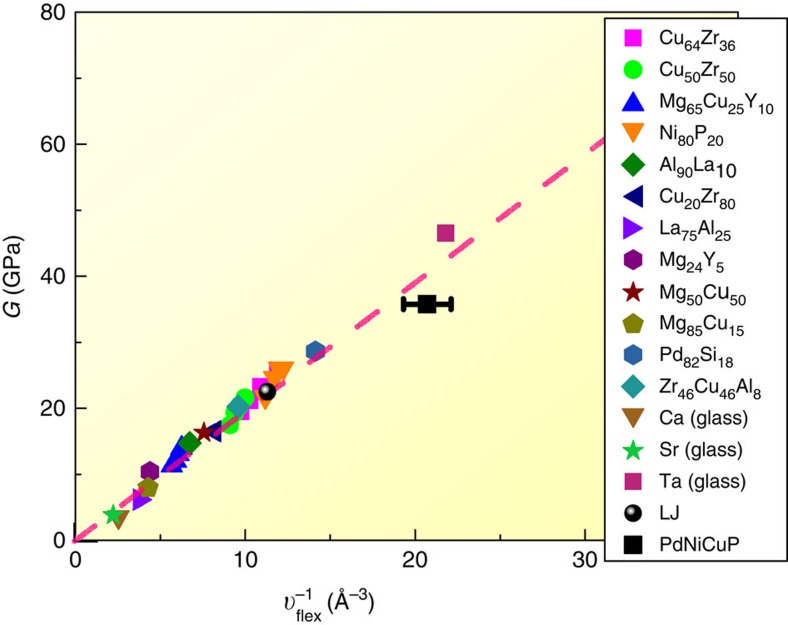
Figure 2. Correlation between shear modulus and flexibility volume in metallic glasses.
The values of G and υflex are computed for 32 MGs at 300 K (see Supplementary Table 1 for different cooling rates and compositions, including an L-J glass). The dashed straight line is the predicted correlation derived in equation (2). The data point for the Pd-Ni-Cu-P MG is from an experimental measurement of both G and υflex (from MSD) for a given sample50 (see discussion in Supplementary Note 2).

