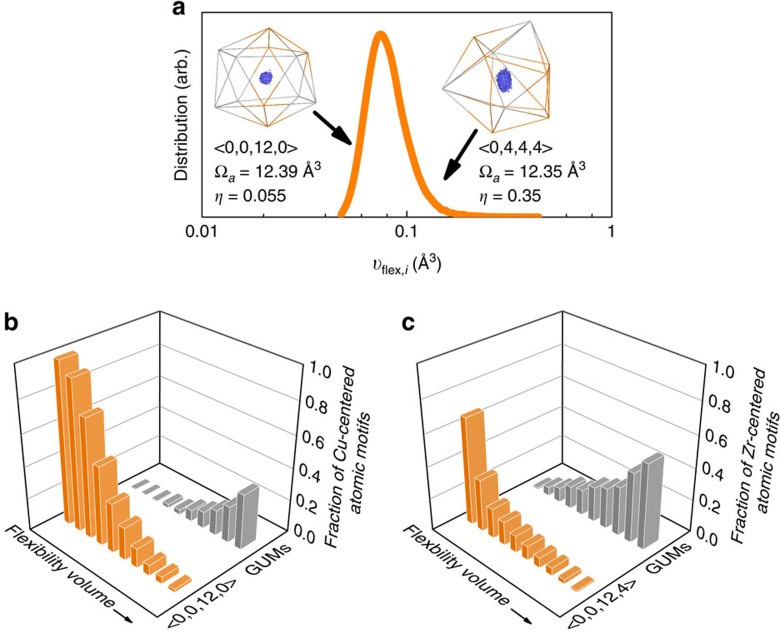
Figure 3. Flexibility volume correlates strongly with local atomic packing structure.
(a) Distribution of flexibility volume (υflex,i) in a Cu64Zr36 MG (Sample G28). The insets show two Cu atoms in this distribution. These two atoms (each at the centre of a Voronoi polyhedron as indexed above) have almost the same atomic volume (Voronoi volume), but the more anisotropic case (higher η) has a value for υflex,i twice as large as that in the more regular full icosahedron. The bi-coloured lines connect nearest neighbours (grey for Zr and gold for Cu). The central blue region represents the maximum volume sampled during the simulation by the centre of mass of the vibrating Cu atom. In (b) (or (c)), Cu (or Zr) atoms in this Cu-Zr MG are first sorted by their flexibility volume (from low to high), and then divided into ten groups each containing 10% of all Cu (or Zr) atoms. The fraction of Cu-centred <0, 0, 12, 0> (or Zr-centred <0, 0, 12, 4>) and GUM clusters present in these ten groups is then compared. For the 10% of the atoms with the lowest flexibility volume, almost all of the Cu atoms are in <0, 0, 12, 0> (and Zr in <0, 0, 12, 4>) clusters, whereas most of the 10% atoms with the highest flexibility volume are in GUMs.

