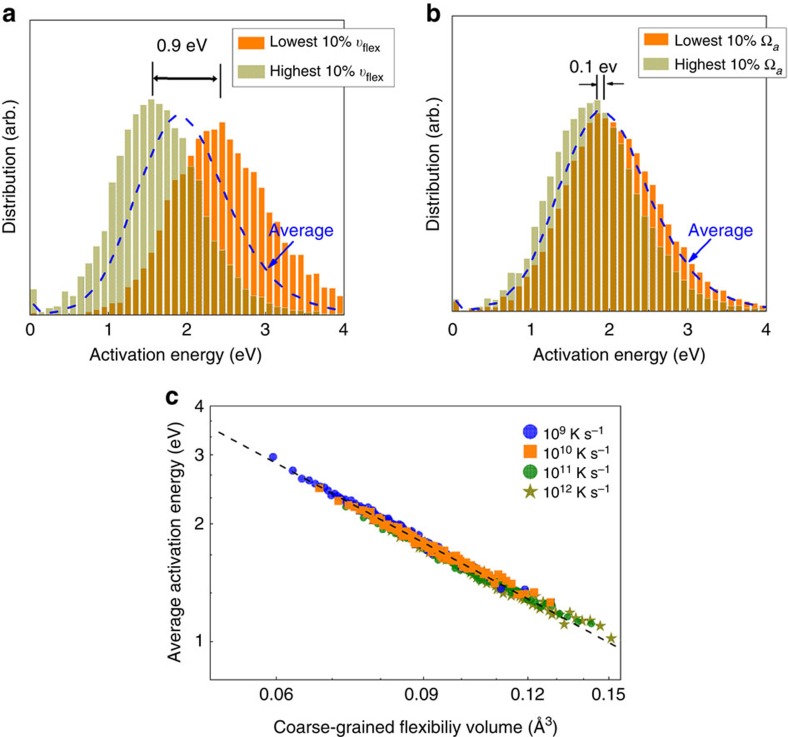
Figure 4. Flexibility volume correlates strongly with thermally activated relaxation events.
Distribution of activation energy in a Cu64Zr36 MG (Sample G28, with 10,000 atoms and the cooling rate of 109 K s-1) characterized using ART nouveau. The activated relaxation events are for (Cu and Zr) atoms in the centre of their coordination polyhedra. The blue line is for the distribution of activation energy in the entire sample, whereas (a) shows the two groups with the highest and lowest 10% of the values for the flexibility volume (υflex,i), and (b) is for the two groups with the highest and lowest 10% of the values for the atomic volume (Ωa,i) . For (a) and (b) both Cu and Zr atoms in the distribution are counted to avoid possible biases due to different chemical elements (that is, for the 10% of the atoms with the highest values of υflex,i, we select both the top 10% Cu and the top 10% Zr atoms). Here each curve is normalized by the total number of activated events sampled by the entire group of atoms involved in the distribution. While the two groups almost overlap in the case of Ωa,i, the bifurcation between the two groups is obvious in the υflex,i case, with the two peaks separated by 0.90 eV. (c) All the atoms are sorted based on coarse-grained values of υflex,i (see text), into bins each containing 1% of the atoms. An average activation energy is then calculated for the atoms in each bin, and plotted to demonstrate the strong correlation with the coarse-grained flexibility volume. The Cu64Zr36 MG samples used in this plot were produced at several cooling rates.

