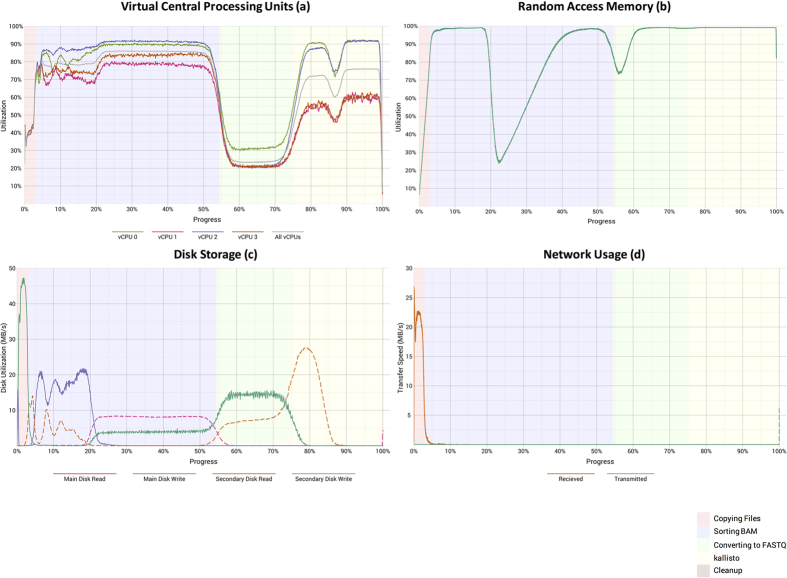
Figure 3. Computational resource utilization while CCLE samples were processed using a cluster-based configuration.
These graphs show the (a) percentage of user and system vCPU utilization, (b) percentage of memory usage, (c) disk activity, and (d) network activity. The “main” disk for each virtual machine had 100 gigabytes of storage space. The “secondary” disks, which stored temporary files during the sorting and FASTQ-to-BAM conversion steps, had 300 gigabytes of space. The background colors represent the five computational tasks shown in Fig. 2. Each graph summarizes data from all 934 CCLE samples.

