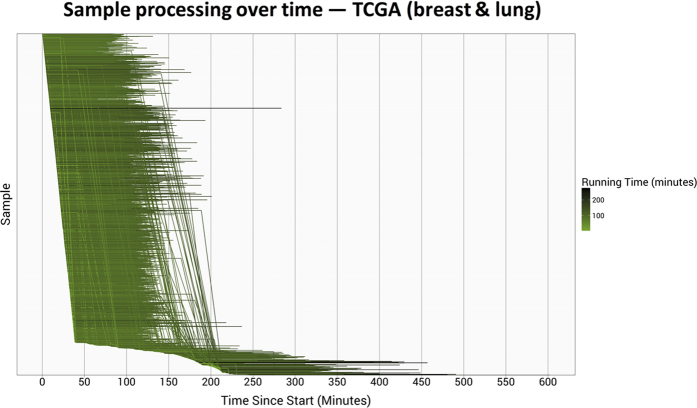
Figure 5. Processing time per TCGA breast and lung sample using a preemptible-node configuration.
The 1,811 TCGA breast and lung samples were processed using a variable number of preemptible virtual machines. The horizontal lines represent the relative start and stop times at which each sample was processed. Darker lines identify samples that took longer to process. Vertical lines indicate times at which samples were preempted and then resubmitted for processing. In total, 210 preemptions occurred.

