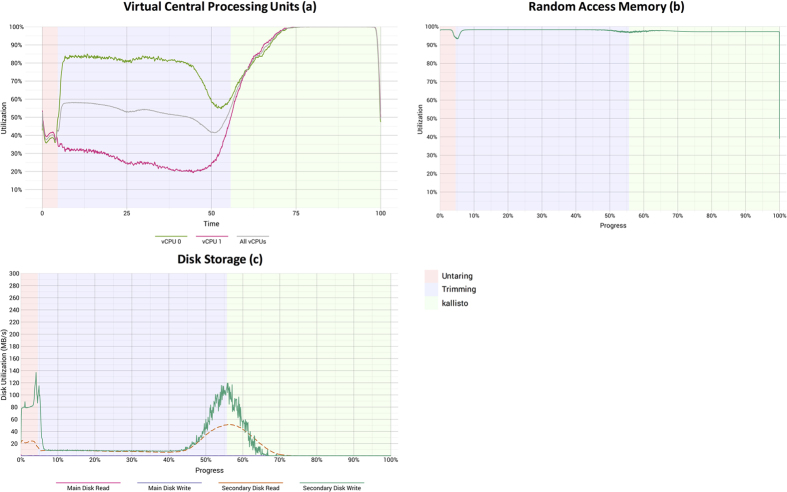
Figure 6. Computational resource utilization while TCGA breast and lung samples were processed using a preemptible-node configuration.
These graphs show the (a) percentage of user and system vCPU utilization, (b) percentage of memory usage, and (c) disk activity. The “main” disks had 10 gigabytes of storage space and stored operating-system files. The “secondary” disks, which stored all data files, had 350 gigabytes of space. The background colors represent the computational tasks shown in Fig. 4. We were unable to collect performance metrics for preliminary tasks, such as file localization, because these tasks were not performed within the software container. Each graph summarizes data observed across all 1,811 TCGA lung and breast samples. Because there was typically only one pair of FASTQ files per sample, quality trimming could not be parallelized; therefore, we used only 2 vCPUs per sample.

