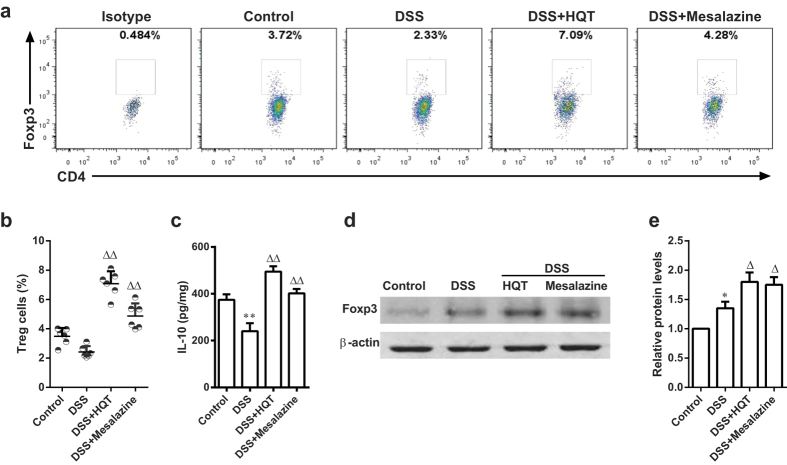
Figure 8. HQT induces Treg cells in mice with DSS-induced chronic colitis.
Mice received three cycles of DSS treatment (2.5%), each cycle consisting of 7 days of water containing DSS followed by 14 days of tap water, followed by treatment with HQT for 7 days. LPMCs were isolated from each group and subjected to intracellular Foxp3 staining. (a) The frequency of Treg cells (CD4+CD25+Foxp3+) determined by flow cytometry. Numbers indicate percentages of Foxp3-expressing CD4+CD25+T cells in each quadrant. (b) Quantitative analysis of the frequency and total number of Treg in LPMCs. (c) IL-10 in colonic homogenate determined by ELISA. (d,e) Western blot analysis of Foxp3 protein expression in the colon. The gels were run under the same experimental conditions. Densitometric analysis to determine the relative ratios of Foxp3 protein. Results are expressed as mean ± SD of three independent experiments; n = 8 mice per group. *p < 0.05, **p < 0.001 vs. the control group; △p < 0.05, △△p < 0.001 vs. DSS-treated mice. Treg, regulatory T cells; LPMC, lamina propria mononuclear cells; ELISA, enzyme-linked immunosorbent assay; IL, interleukins.

