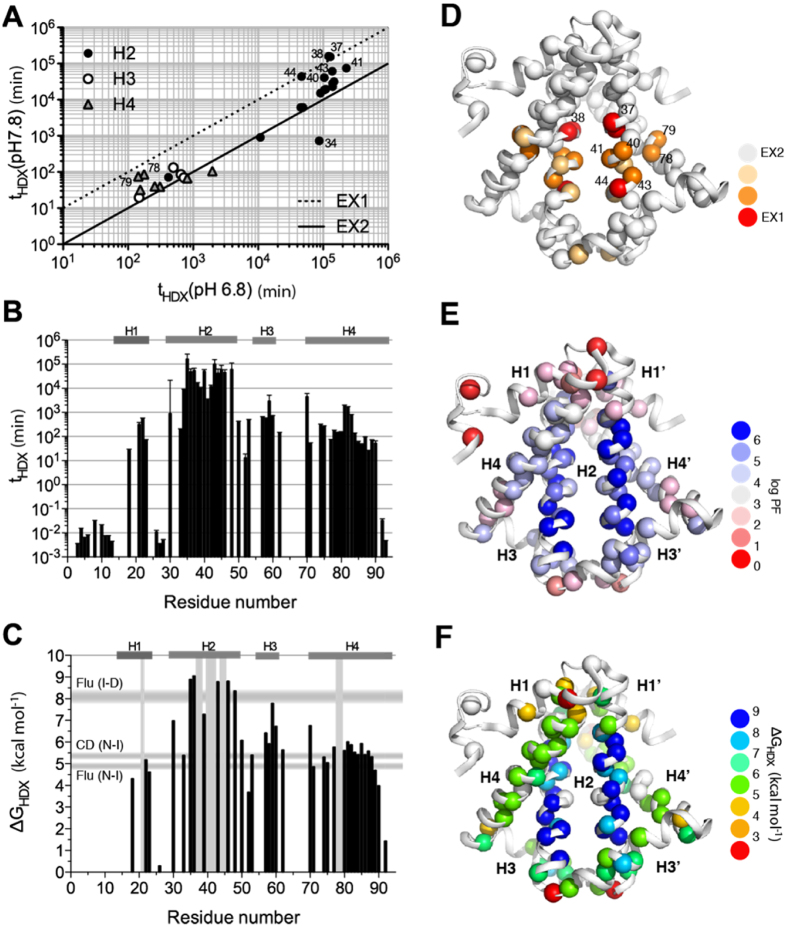
Figure 1. NMR HDX analysis of HP0242.
(A) Comparison of the HDX time constants of HP0242 obtained at pH 6.8 and pH 7.8. The solid and dashed lines correspond to the expected correlations of the times constants under the EX2 and EX1 conditions. The residues in helices 2 (H2), 3 (H3) and 4 (H4) are shown in filled circles, open circle and grey triangle, respectively. Those that deviate significantly from the EX2 condition are labelled with the residue numbers. (B) HDX time constants as a function of residue number. (C) ΔGHDX as a function of residue number. The locations of the EX1 residues are indicated by vertical grey bars. The ranges of free energies of unfolding for native-to-intermediate (NI) and intermediate-to-denatured (ID) derived from far-UV CD and intrinsic fluorescence are shown as horizontal grey bars as indicated on the left. (D–F) Structural mappings of the individual NMR HDX-derived parameters as shown in panels (A–C). The amide nitrogen atoms are shown in spheres with colour coding as indicated on the right hand side.

