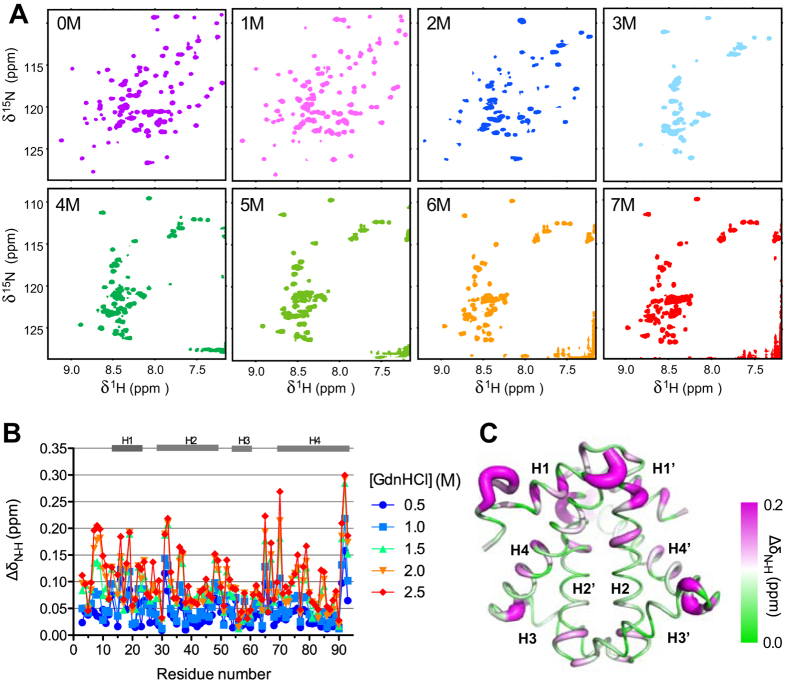
Figure 4. Chemical denaturation of HP0242 monitored by NMR.
(A) A series of 15N-1H SOFAST-HMQC spectra were recorded for HP0242 in the presence of various amounts of GdnHCl as indicated in each panel. (B) Weighted chemical shift perturbation ΔδN-H as a function of residue number, and denaturant concentration (from 0.5 to 2.5 M GdnHCl, with colour coding from blue to red as indicated on the right hand side). The residues that are in helical regions in the native state are indicated by grey bars on the top of panel B and numbered from H1 to H4 according to the reported the crystal structure of HP0242 (PDB entry: 2BO3). (C) Structural mapping of the weighted chemical shift perturbations of HP0242 in the presence of 2.5 M GdnHCl compared to those in native condition (red symbols in (B)). The size of the radius of the sausage representation corresponds to the magnitude of the chemical shift perturbation. It is also colour-ramped from green to magenta as indicated on the right hand side.

