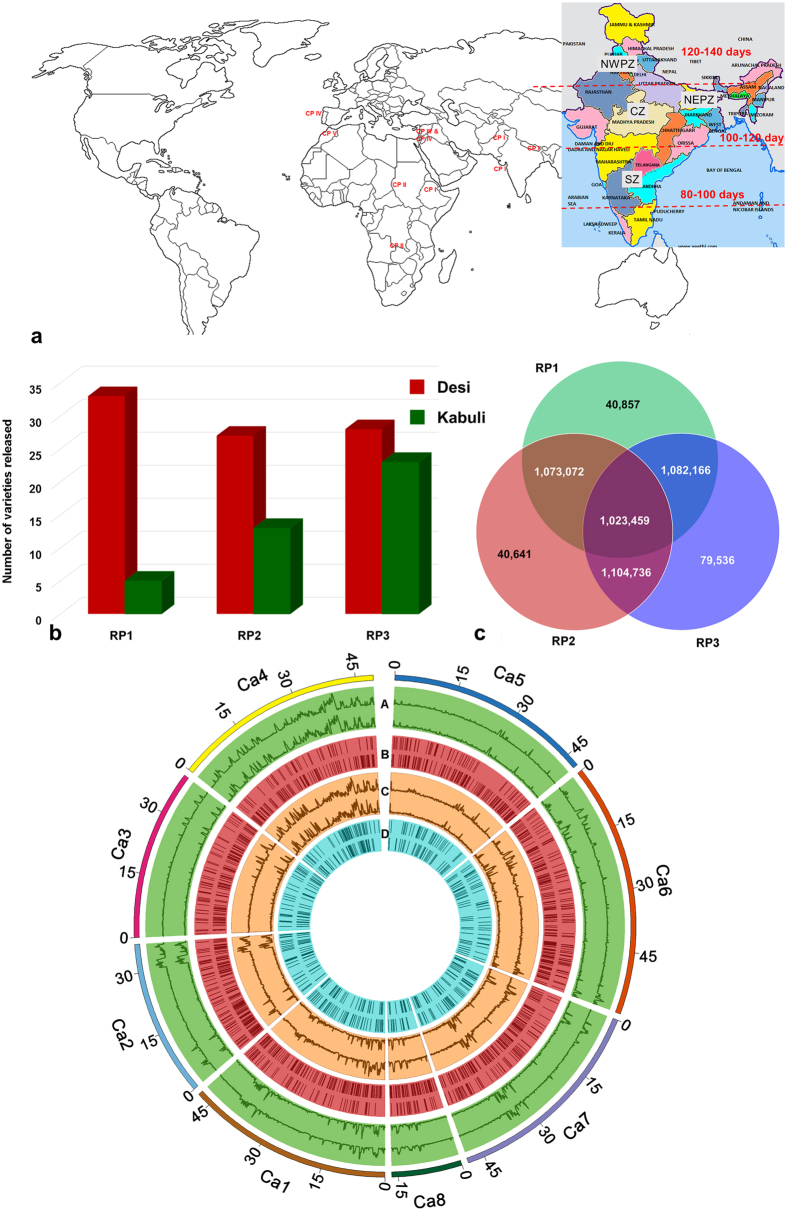
Figure 1. Global distribution of 129 chickpea varieties and genome-wide variations.
(a) A set of 129 varieties released in 14 important chickpea growing countries across the globe. The varieties used in the study encompass all five global chickpea research domains (CPI, CPII, CPIII, CPIV and CPV) as well as all chickpea growing zones in India (North Western Plain Zones, NWPZ; North Eastern Plain Zones, NEPZ; Central Zone, CZ and Southern Zone, SZ). Information on chickpea research domains across the globe and growing zones in India is taken from public domain, while the maps were drawn using licensed ArcGIS software 10.3 for Desktop. (b) For understanding the temporal trends in diversity, and to avoid biased estimates 129 varieties are grouped into three time periods (i) varieties released in RP1 (before 1992), (ii) varieties released in RP2 (between 1993 and 2002), (iii) varieties released in RP3 (after 2002). An increase in number of kabuli varieties after 2002 can be observed. (c) Venn diagram represents both shared SNPs as well as unique SNPs among varieties released in different time periods. Large number of unique SNPs in varieties released after 2002 indicates an enhancement in diversity in the primary gene pool as a result of recent breeding programs. (d) Circos diagram represents the genome - wide variations among 129 varieties. Eight pseudomolecules are traversing from out to in: (A) SNP density (green), upper half desi and lower kabuli, (B) copy number variations, (C) Indel density and (D) presence and absence variations.

