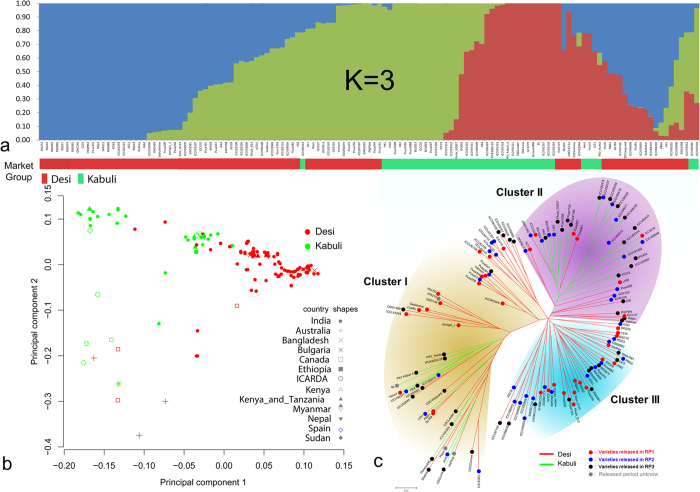
Figure 2. Genetic diversity and population structure in 129 chickpea varieties.
(a) Population structure analysis using 1,378,790 SNPs with Frappe software45 clearly indicates three sub-populations, (b) Principal component analysis clearly demarcate the Canadian and Australian varieties, (c) Released varieties from three different periods (RP1 (before 1992), red circles; RP2 (between 1992 and 2002), blue circles and RP3 (after 2002), black circles) were grouped into three clusters (Cluster I, Cluster II and Cluster III). Clustering indicate the diversity among all three release periods and grouping of kabuli varieties with desi in Cluster I. Grouping of some desi with kabuli in Cluster II was due to inter crossing of desi and kabuli genotypes and vice versa for enhancing yield and disease resistance.

