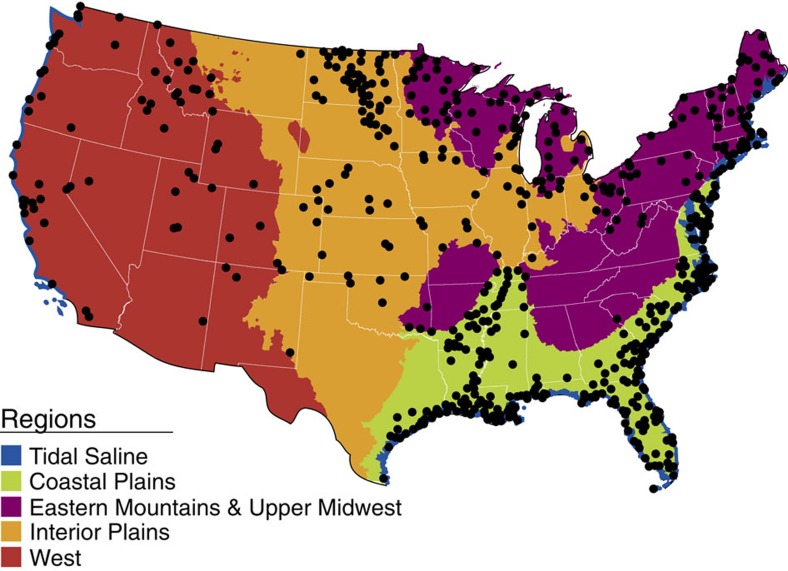
Figure 1. Map of the distribution of wetland probability sites.
Sites (black points) were sampled as part of the US Environmental Protection Agency's 2011 National Wetland Condition Assessment (NWCA) and were analysed by five regions, Tidal Saline (blue area), Coastal Plains (green area), Eastern Mountains and Upper Midwest (purple area), Interior Plains (orange area) and West (red area).

