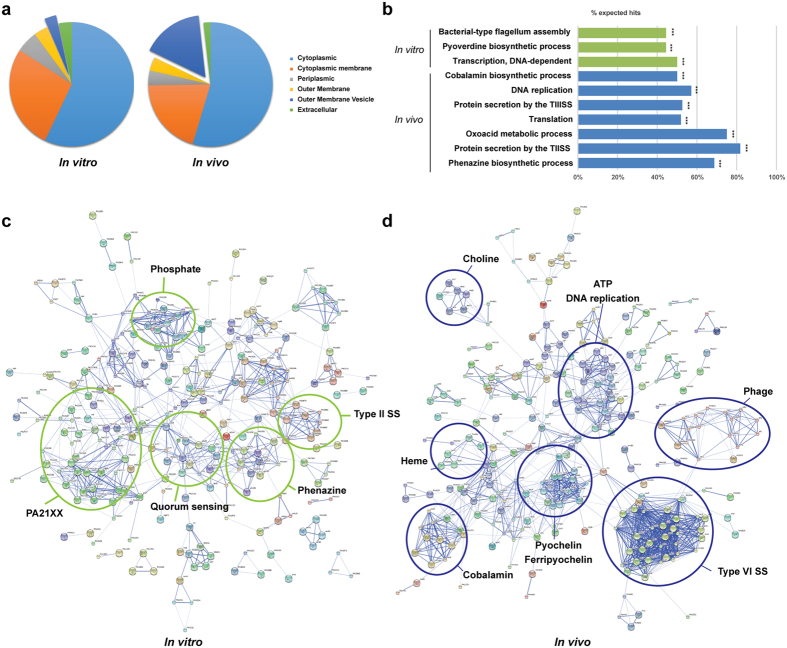
Figure 1. Characterization of P. aeruginosa gene expression in vitro and in vivo.
(a) Primary cellular localization of the products of the genes of P. aeruginosa PAO1 differentially regulated in vivo and in vitro. The percentage of the total number of genes whose expression was significantly up-regulated in vivo compared to in vitro are represented on the left; the percentage of genes whose expression was significantly up-regulated in vitro compared to in vivo are represented on the right. Genes were classified according to their known and predicted cellular localization. (b) Hypergeometric test enrichment analysis on annotation of P. aeruginosa PAO1 genes differentially regulated in vitro and in vivo. Data are represented as the percentage of genes (hits) in each class which expression was significantly up-regulated in vitro (green) or in vivo (blue). The subsets in which the number of hits was significant are denoted with asterisks (***p < 0.001). STRING analysis representing the 300 most highly upregulated P. aeruginosa PAO1 genes expressed in vitro (c) or in vivo (d). Gene products are represented with circles and known associations between each gene or gene products are represented with a connecting line. Nodes of genes participating in similar functions are circled in green (expressed in vitro) or in blue (expressed in vivo).

