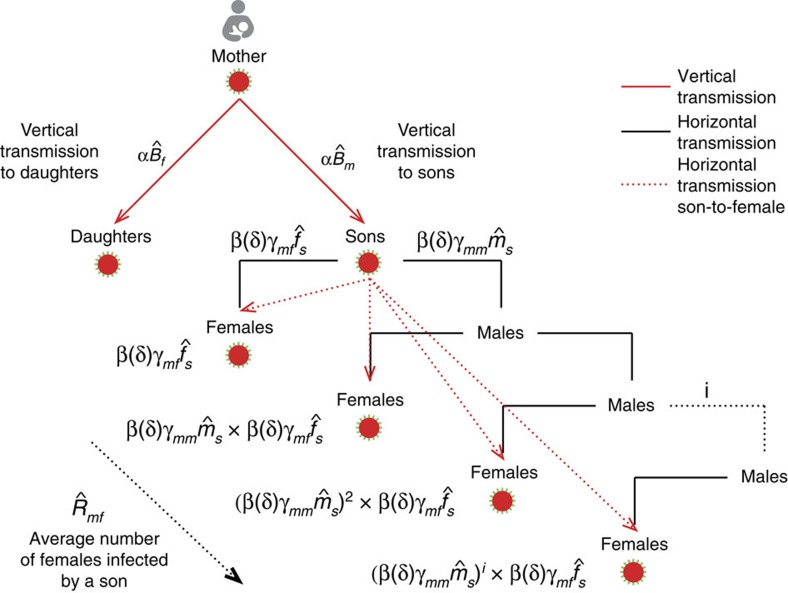
Figure 2. Interpretation of parameters.
Interpretation of parameter  and expression
  .
.  is the average number of females horizontally infected by a son and the male infections he will give rise to and results from adding up all possible transmission events to females.
  is the effective rate of vertical transmission. It results from calculating the probability of vertical transmission to sons and daughters and horizontal transmission from son to females with whom he establishes contact.

