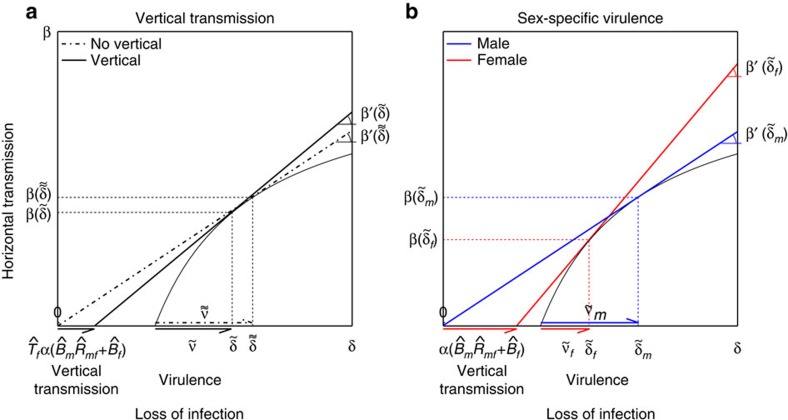
Figure 3. Interpreting the ESS virulence levels with a graphical method.
We use a graphical method similar to the one developed by van Baalen and Sabelis43 to determine which ESS virulence will be greater. (a) Comparison between the ESS virulence with and without vertical transmission in the absence of sex-specific strategies. Without vertical transmission (α=0) the ESS exploitation strategy ( ) is the point where the tangent of the horizontal transmission function (β′(δ)) crosses the abscissa in δ=0. With vertical transmission (α>0), the ESS exploitation strategy (
 ) is the point where the tangent of the horizontal transmission function (β′(δ)) crosses the abscissa in
  . Notice that the tangent of the horizontal transmission function at the ESS is higher or equal with vertical transmission, that is
  . This implies that the ESS virulence is greater or equal without vertical transmission, that is
  . (b) Comparison between the ESS virulence when the virulence can differ in males and females. With male-specific virulence (
 ) the ESS exploitation strategy (
 ) is the point where the tangent of the horizontal transmission function crosses the abscissa in δm=0. With female-specific virulence (
 ) the ESS exploitation strategy (
 ) is the point where the tangent of the horizontal transmission function crosses the abscissa in
  . Notice that the tangent of the horizontal transmission function at the ESS is higher or equal with female-specific virulence, that is
  . This implies that the ESS virulence is greater or equal in males,
  .
.

